
Training Science
Series: STRONGMAN DATA LAB: HOW WE MEASURE AND ANALYSE PERFORMANCE - Episode 10: Building a Complete Monitoring System for a Strongman Athlete
October 15, 2026
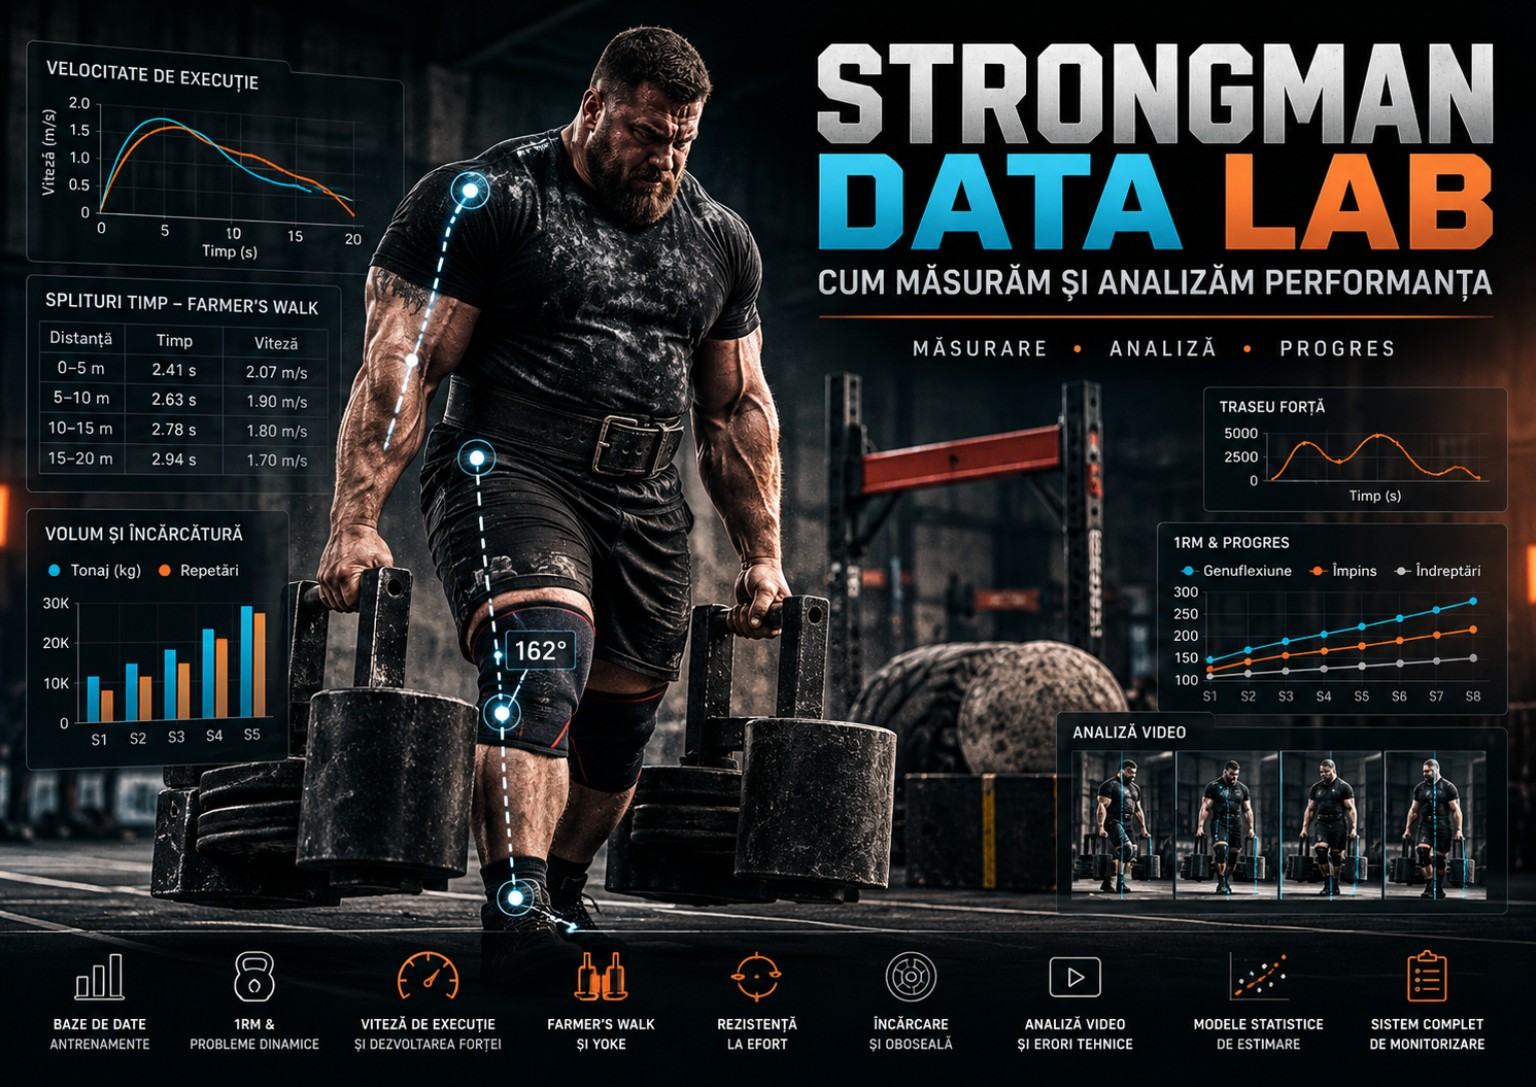
An athlete finishes a Farmer’s Walk with 130 kg in each hand and reads 24.6 seconds on the clock. Their phone contains a video, the training log records the weight, and they suspect time was lost during pickup. That evening, a different file contains a note about high session difficulty and poor sleep. The following day, three charts and four numbers are available, but the coaching decision remains unclear. The problem is not a lack of data. The observations have not yet learned to speak the same language.
STRONGMAN DATA LAB: HOW WE MEASURE AND ANALYSE PERFORMANCE reaches Episode Ten, its concluding synthesis. Previous episodes defined measurable outcomes, established a training database, examined relationships between 1RM and dynamic performance, studied movement velocity, analysed Farmer’s and Yoke splits, addressed repetitive events, explored workload and fatigue, reviewed video methods and tested statistical forecasting. The new question concerns architecture: how can these components be connected in a system that is usable, consistent and rigorous enough for decisions to be evaluated?
We will not begin with the promise that software can determine tomorrow’s ideal weight. We begin with strongman reality: implements that differ between gyms, courses of varying length, events scored by time, mass, distance or repetitions, and competitors balancing work, travel, competition and recovery. A good system does not compress those differences into one magical number. It preserves event identity and connects observations without inventing equivalences.
This episode proposes a practical Strongman Data Lab: collection rules, file structure, quality-control procedures, selected indicators, visualisations, simple models and a review routine. We will explain how an independent athlete can begin with a phone and spreadsheet, and how the same structure can evolve into a team or research project. Throughout, we distinguish measurement from estimation and interpretation, and athletic monitoring from medical diagnosis, which no dashboard can replace.
Numerical examples below are constructed for teaching and do not represent hidden measurements of real athletes. Scientific sources support methodological principles and relevant knowledge; where lessons from other sports are adapted to strongman, limitations will be made clear. A scientific system is defined not by sensor count, but by its ability to answer specific questions and acknowledge insufficient evidence.
1. Purpose of a complete system: observation, decision and verification
A monitoring system becomes complete not when it captures every conceivable metric, but when it supports a repeatable path from observation to decision and from decision to evaluation. If a competitor slows during Yoke, we want to know whether the loss occurred at pickup, late in the course or after a change of surface. We can then choose an adjustment or test and examine whether it helped. Without this feedback loop, a large archive remains a warehouse of numbers.
Three purposes must be distinguished. Documentation records what was actually performed. Monitoring describes how performance changes under comparable conditions and how it relates descriptively to recent workload. Decision support identifies modifications worth testing in future programming. None of these functions automatically authorises medical conclusions about pathological fatigue, injury or endocrine health.
Imagine an athlete completing a twenty-metre Farmer’s course at 110 kg per hand in 16.1 seconds, and a month later in 15.0 seconds. Under similar implement, surface and timing conditions, improvement is observable. If one run used different handles or a different timing definition, the conclusion becomes weaker. The system should show both the number and the conditions that give it meaning.
Every metric must justify its burden by answering a real question. Does it help select loads, improve a transition, reduce invalid attempts or organise recovery? If not, collecting it may be optional. A Data Lab’s quality is seen in more explainable decisions and sustainable training, not a crowded dashboard.
2. Ten episodes become ten interoperable components
Every previous episode developed a distinct component. Performance definitions supply the outcome vocabulary; databases provide organisation; relationships with 1RM contextualise strength; velocity tracks one manifestation of force-related performance. Farmer’s and Yoke analysis establish dynamic-event segmentation, while repetitive-event analysis distinguishes cycle phases. Workload monitoring adds context, video adds technical observations and statistics assesses whether unseen results can be forecast responsibly.
These components should be linked by common identifiers rather than forced into invented fatigue points. One Log attempt can have an official result, implement mass, perceived effort, a video and several phase durations. All describe the same attempt, but they are different variables. Together they support interpretation; separately they can appear contradictory because their context is missing.
There is a useful hierarchy. At the foundation are raw observations and metadata: time, task, conditions and result. Derived indicators such as speed, averages, phase distributions and internal-load indices sit above them. Interpretations and hypotheses follow. Only then come decisions: maintain programming, modify an event, conduct a reference test or seek appropriate health assessment. Reversing this order encourages selective use of data to justify decisions already made.
Integration does not initially require expensive software. A table with stable IDs, organised video folder and consistent review sheet can establish the essential relationships. Sophisticated infrastructure only helps when scale increases and variable meaning remains intact. Build the architecture before building the dashboard.
3. Modularity: the system must work when some equipment is absent
Not every athlete has access to velocity encoders, multiple cameras or automated tracking. A robust system allows components to be added gradually without becoming useless when a device is missing. Its core records exercises, loads and outcomes. Video adds event phases. Status monitoring adds brief subjective information. Statistical modules assess trends only when enough relevant observations exist.
This design avoids manufacturing values simply to fill a chart. With no encoder, bar velocity remains unmeasured. Without Yoke video, official time can still be logged even if split analysis is unavailable. When an athlete forgets a sleep question, the answer is missing rather than «average sleep». Missing information is neither zero nor an inferred response unless an explicit, defensible estimation method has been applied.
Imagine three athletes using one database. The first records sets and event times, the second adds video and the third also uses velocity measurement for Squat. All can benefit from comparable event logs, although not every analysis applies to every person. Group reports should identify how many observations are available for each indicator and avoid comparisons where methods or data coverage differ materially.
Modularity also makes removal possible. If an HRV metric never informs decisions and creates confusing variation, the system can continue without it. A useful Data Lab is not captive to its sensors. Measurement tools remain subordinate to sporting questions.
4. Define the vocabulary: every field needs one meaning
Before analysing anything, agree on the meaning of «working set», «attempt», «valid repetition», «pickup duration», «completed distance» and «total load». A Log repetition may require a new clean or may be one of several presses from the same rack position. If the database fails to distinguish those rules, similar scores may represent different tasks. Farmer’s mass may refer to each hand or the pair. A value without units and definitions invites mistakes.
A data dictionary should contain a variable name, operational meaning, unit, collection timing, source, permitted values and treatment of missing or invalid observations. For example, «farmer_mass_each_kg» is different from «farmer_total_kg». «yoke_time_s» must explain whether pickup is included and what event starts the clock. Conventions may be imperfect, but they must be applied consistently.
For bilingual teams, stable technical identifiers can be paired with readable Romanian and English labels. «Valid repetition» and «repetare validă» can refer to one underlying variable without duplicating its data. Separate fields for the same fact merely because the user interface has two languages create unnecessary inconsistency. This approach helps export and cooperation between projects.
Definitions may evolve but changes need versioning. If Yoke timing begins at the first movement from November onward while earlier records used the start signal, the series is no longer fully homogeneous. Do not silently rewrite history. Record the protocol change and analyse separately where required. Longitudinal quality depends on stable measurement language.
5. Stable identifiers connect athletes, sessions and attempts
A database can be organised through athletes, sessions, exercises, attempts, test conditions, video files and status assessments. Each should have a unique identifier. A Yoke attempt belongs to an athlete and session, uses a defined frame and course, and may link to two videos and several annotations. The same result should not be duplicated in three tables whenever new information is added.
Suppose «ATH-004» performs attempt «ATT-0183» during session «SES-20261015-02». It is a 320 kg Yoke over twenty metres, completed in 19.4 seconds, with three video splits. If a timestamp is later corrected, every analysis can still refer to the same attempt through its ID. Relationships do not have to be reconstructed from memory or a filename, while a revision history remains possible.
Friendly filenames help, but must not be the sole key. Two phone cameras can each produce a file called «VID_001». Stable internal identifiers prevent accidental overwriting and mismatched athlete records. Coded IDs can also reduce unnecessary exposure of full names in analytical exports.
A coherent relationship structure supports straightforward questions. Which Yoke attempts preceded the last competition? Which videos belong to the slowest course? What internal session difficulty was reported that day? With consistent keys, these answers can be retrieved without hours of manual searching.
6. A minimum table architecture for Strongman Data Lab
A practical schema may contain «Athletes», «Sessions», «Attempts», «Implements», «Courses», «Readiness», «VideoFiles» and «Annotations». Not every implementation needs eight separate spreadsheets immediately; one independent athlete might combine some sheets. The logical distinctions should remain. Frame characteristics belong to the implement definition when stable across attempts, while athlete details should not be copied into every working set.
«Sessions» stores date, training phase, session type, duration, global RPE and notes. «Attempts» records event, mass, distance, repetitions, time, validity and order within the session. «Implements» describes bars, Logs, frames and handles. «Courses» identifies surface, length and turns. «VideoFiles» stores recording metadata and a link rather than necessarily embedding large binary files into the primary database.
In a hypothetical Saturday session, an athlete performs three Farmer’s runs, two Yoke runs and four Atlas attempts. The database contains one session and nine attempts, not nine sessions. Adding four video recordings does not change the number of attempts. This distinction prevents errors when calculating session duration, event frequency or overall workload.
The design should support simple exports and preservation of raw values without dependence on one vendor. FAIR principles concerning findability, appropriate accessibility, interoperability and reuse offer useful methodological guidance [9]. In athlete monitoring, «accessible» does not mean publishing private records; it means authorised access governed by clear rules and documentation.
7. Apparatus standardisation: equal mass does not mean identical tasks
Equipment influences strongman outcomes. Two Yoke frames at 320 kg can differ in width, height, rigidity and mass distribution. Two Farmer’s handle sets may stress grip differently even with identical mass per hand. If the database stores only kilograms, a coach may misattribute apparatus-induced variation to adaptation or fatigue. Strongman biomechanics reviews document the diverse demands of these specialised events [1].
Each important implement needs an identifier and a few relevant properties. For Yoke, record the model, lifting height and meaningful loading configuration. For Farmer’s, handle diameter and texture, mass per hand and object characteristics are useful. Log dimensions, handle positioning and cleaning rules can change outcome interpretation. There is no reason to document every bolt; select characteristics with plausible consequences for comparison.
Imagine an athlete completing a twenty-metre 300 kg Yoke in eighteen seconds at the usual gym and twenty seconds elsewhere. Without implement identity, this appears to be regression. But a less stable frame with a higher pickup changes the task. The two observations may not isolate physical capacity. The report should identify two testing conditions rather than treat them as identical trials.
Standardisation does not mean avoiding unfamiliar implements. Competition preparation often requires exposure to new equipment. Record those changes and ask a more appropriate question: how does the athlete adapt to this apparatus? Consistent reference tests can coexist with contest-specific work without forcing every result into one statistical series.
8. Farmer’s and Yoke courses as distinct entities
Distance is a defining condition in loaded locomotion. A ten-metre Farmer’s run contains proportionately more pickup than a forty-metre run, while a turning course differs from a straight path. Surface, slope and corridor width can change pace and stability. A course therefore deserves its own identity in the database instead of being represented only by total distance.
Course metadata can include length, turn count, flooring type, corridor width and timing method. If five-metre markers are available, document them for split analysis. Start-signal time and first-movement time should be distinguished whenever both are used. Differences of tenths of a second may reflect timing definitions rather than changes in acceleration.
In a teaching example, a competitor completes 320 kg Yoke over twenty metres in 19.2 seconds on level flooring and 21.0 seconds on a course involving a turn. Do not declare that the athlete’s speed deteriorated by nine percent. Turning introduces different demands. Trends can be compared within each protocol, but converting exactly between courses requires additional relevant evidence.
Video archives should preserve visible distance markers where possible. If one evaluator stops timing when the frame crosses the line and another when the athlete steps across, their results are not necessarily equivalent. Define the event and train observers to apply it consistently. A good reference course is safe, repeatable and relevant to the performance question.
9. Conventional lifting: Squat, Bench, Deadlift and Press
For conventional lifts, retain loading, set and repetition counts, exercise variation, rest duration and perceived effort when collected. High-bar Squat is not automatically equivalent to Front Squat. Floor Deadlift differs from Rack Pull in range of motion, and an estimated maximum from one variation is not a directly observed maximum in another. Records must reflect what happened rather than hide differences under overly broad labels.
External tonnage can be calculated as the sum of sets multiplied by repetitions multiplied by mass for exercises where that definition is meaningful. But Bench, Squat and Log tonnage do not represent identical mechanical work or tissue loading. One weekly kilogram total may summarise some aspects of volume but cannot describe every feature of training stress. Athlete-load monitoring consensus stresses context-specific interpretation [2].
Imagine five Squat sets of five repetitions at 150 kg, producing 3,750 kg of prescribed external tonnage. A month later the athlete performs the same structure at 160 kg, producing 4,000 kg. This is an observable increase, but does not independently demonstrate hypertrophy, greater maximal strength or optimal recovery. Range of motion, execution quality, RPE and the rest of the programme remain relevant.
Stable naming conventions and equipment metadata improve comparability: stiff versus flexible bars, straps, paused repetitions and tempo variations. Training variety remains useful; the purpose is to avoid false equivalence. A Data Lab must recognise progression within a given task while remaining cautious about comparisons across different variations.
10. Repetitive events: the set is not enough, each cycle matters
In Deadlift for Reps, Log for Reps or Tire Flip, a final score can conceal very different mechanisms. Ten repetitions may be completed with constant rhythm, increasingly long pauses or several invalid attempts. A complete database may preserve the official count alongside validation timestamps when available. Every cycle need not be analysed in every session, but collected phase data require consistent definitions.
For Log, we can separate clean, rack transition, pressing and lockout. Tire Flip may benefit from separating lift-off and transition into final pushing. During Deadlift, the interval between repetitions differs from concentric phase duration. Video and temporal analysis from earlier episodes support these distinctions, but do not automatically reveal precise physiological causes. A slower phase is not proof that a particular muscle is the limiting factor.
In a hypothetical seventy-five-second Log session yielding eight valid repetitions, timestamps show that the last two cleans take nearly twice as long as the earliest. The coach might test pacing or transition drills. However, if a new strategy produces faster cleans but more rejected presses, it may not improve competition outcome. Full valid performance remains the central criterion.
An invalid repetition is an event, not a zero inserted among accepted repetitions. Attempt count, accepted count and timing are stored separately. This structure supports later probabilistic analysis while accurately reflecting what occurred in the event.
11. External and internal load: multiple views of one session
External load describes performed work: mass, sets, repetitions, distances, runs and active duration. Internal load concerns aspects of the athlete’s response, including whole-session perceived exertion. Bourdon and colleagues’ consensus distinguishes these dimensions and emphasises methods appropriate to the sport [2]. Separation is especially important in strongman, where different events produce markedly different mechanical demands.
An accessible internal-load method multiplies session RPE by session duration, consistent with the approach discussed in the literature [4]. A ninety-minute session rated RPE 7 produces 630 arbitrary units. That figure is not calories, tissue force or a direct quantity of fatigue. The RPE scale and rules about whether waiting time is included need to remain stable across comparisons.
Imagine two ninety-minute sessions both scoring 630 AU, one focused on Squat and RDL, the other on Yoke and Farmer’s. Their internal indices match, but mechanical and technical loading differs. They cannot automatically be considered interchangeable. A dashboard should therefore show session-level internal load alongside external exposure by movement family rather than compressing everything into one score.
If similar external tasks begin to feel more difficult, the trend deserves discussion. It is not an automatic diagnosis of overtraining. Review sleep, context, exercise order and reference performance before making a proportionate decision. A good Data Lab generates clearer questions before issuing warnings.
12. Readiness monitoring: a short questionnaire used well
Athletes can answer a few daily questions about perceived sleep quality, energy, general muscle soreness and stress. The value lies in consistent use, not supposed diagnostic capability. Saw and colleagues’ systematic review found subjective measures often responded more sensitively to training-load changes than many commonly used objective markers [5]. Athlete experience deserves serious attention without being treated as infallible.
Questions need consistent anchors and must be short enough for honest completion. Switching from a one-to-five scale to one-to-ten should be documented. Coaches need not request intimate personal details to explain minor performance changes. Collect information proportionate to the sporting purpose and protect privacy. Intrusive monitoring can actually degrade reporting quality by pressuring athletes to provide answers perceived as acceptable.
Imagine three days of poor reported sleep and low energy accompanied by a modest reduction in fixed-load Squat velocity. The association deserves investigation but does not prove sleep is the sole cause. Programme changes, nutrition, health and measurement variation are alternative explanations. Persistent or important symptoms require appropriate assessment rather than an automated red-light judgement.
Dashboards may display trends without inventing a «recovery percentage». Sometimes a brief sleep note beside an event result is sufficient. If indicators disagree, preserve both and examine context. Readiness monitoring should remain a collaboration with the athlete rather than a formula replacing their judgement.
13. Reference tests: a few stable tasks within an evolving programme
Training should not remain identical from week to week. An athlete may move from hypertrophy to intensification, change events and practise unfamiliar competition apparatus. A few well-defined reference tests can therefore help reveal trends amid programme variation. They need not be maximal or so demanding that they disrupt recovery. A useful test is relevant, repeatable and physiologically inexpensive enough to integrate without undermining the wider cycle.
Possible references include one fixed-load Squat repetition, a moderate twenty-metre Yoke run and a short Log set under stable rules. They need not occur on the same day. Each requires documented warm-up, mass, range of motion and validity criteria. A repetition moving faster only because its range became smaller is not demonstrated improvement. Comparable execution must be checked before the result is interpreted.
Imagine an athlete tracking Squat velocity at 150 kg across several weeks. Four values are similar, then one is slower after demanding training. This may reflect acute fatigue but also technical or measurement variation. Review the diary, exertion and comparable repetitions. A single low value does not automatically justify medical conclusions or mandatory reduction of the entire programme.
Reference data complement competition outcomes, which can be rare and vary markedly between events. Across months, the system can test whether a stable marker has any useful relationship with actual contest performance. If it does not inform coaching decisions, reconsider it. Repeatability is necessary but practical relevance must also be demonstrated.
14. Video as contextual evidence, not universal biomechanics equipment
Video reveals pauses, transitions, implement movement and the sequence of valid attempts. A camera records two-dimensional images rather than joint forces, muscle activation or tissue stress. Episode Eight explained how camera angle, frame rate and calibration influence interpretation. In the final system, every recording should link to the correct attempt and every derived metric must identify its method and limitations.
A Yoke attempt may be recorded laterally and from the rear when camera placement is safe and does not obstruct the course. Lateral footage supports pickup and travel-rhythm analysis; rear footage helps observe lateral corrections. Two ordinary recordings, however, do not automatically produce calibrated 3D motion capture. Do not calculate spinal forces from a pixel trajectory or diagnose pathological asymmetry from an oblique view.
Suppose Farmer’s finishing time increases by two seconds. Video shows an athlete regripping the right handle after ten metres. Record the visible event and propose that grip difficulty may have contributed. Its exact share of time loss remains unknown without further investigation. During the next comparable training session, grip strategy may be tested. Video helps precisely because it narrows the useful questions.
Archive the original file, camera view, timing characteristics and processing transformations. Stabilised, cropped or slowed footage may work for presentation but should not silently replace source material during timing analysis. When an event is not clearly visible, mark it unmeasured. Rigour sometimes means refusing to invent precision.
15. Velocity sensors: when does another device earn its place?
Linear transducers and related tools can provide movement-velocity estimates during selected exercises. They are worthwhile when the measurement protocol is reproducible and velocity genuinely informs programming. Velocity-based training literature describes possible autoregulation applications alongside methodological limitations [6]. Devices do not all measure the same variable, so their values need interpretation in relation to the specific method and task.
For fixed-load Squat, changes in mean concentric velocity can serve as descriptive markers if depth, intent to accelerate and sensor placement are consistent. Yet one slower day does not independently diagnose overtraining, disease or loss of maximal strength. Strongman implements and multiplanar movements introduce additional validation problems. A sensor tested with an Olympic bar is not automatically validated for every Log or Yoke configuration.
Imagine a reference Squat repetition at 150 kg yielding 0.56 m/s, then 0.51 m/s later. The roughly nine-percent difference deserves attention, but first compare it with ordinary variability. Deeper squatting or altered sensor placement could affect the result. Velocity becomes more informative alongside video, exertion and recent programming rather than as a standalone command.
The modular system remains functional without an encoder. Consistent course timing and repetition records can already support many good decisions. Purchasing hardware should follow a practical question it can answer with adequate validity. More technology cannot compensate for vague variable definitions.
16. Quality control: who checks whether data make sense?
A database can contain thousands of neatly arranged rows and still be wrong. An athlete may enter combined Farmer’s mass in a per-hand column, record milliseconds in a seconds field or code an unperformed test as zero repetitions. Such errors create striking charts and false conclusions. Quality control belongs to ordinary Data Lab operation, not only to preparation before publication.
Basic entry checks include predefined units, compulsory fields for timed events, plausible numerical ranges and valid implement identifiers. An extraordinary record must not automatically be rejected. An unusual result should be checked against source video and conditions before being labelled incorrect. Impossible values such as negative time require a clear review procedure.
Imagine a diary entry claiming 360 kg Yoke over twenty metres in 1.92 seconds. A misplaced decimal point may have turned 19.2 into 1.92, but do not silently correct it on assumption alone. Check the original file, timing source or recorder and retain a correction history. If confirmation is impossible, flag the value as suspicious rather than treating it as valid performance. Data should be auditable.
Periodic checks can also identify duplicates, inconsistent timestamps, mismatched athlete IDs and attempts not linked to a valid session. When one field repeatedly generates errors, the form may be poorly designed. Simplifying entry is often better than blaming the athlete. A usable system tends to produce more reliable records than an overcomplicated one.
17. Measurement error, real change and meaningful progress
Different numbers are not automatically evidence of adaptation. Hand-timed splits, angles extracted from video and sensor velocities all have measurement variability. Atkinson and Nevill described approaches to reliability assessment for sports variables [7]. A practical Data Lab must reflect this through a simple principle: changes smaller than the method’s uncertainty should not be presented as established discoveries.
Imagine Farmer’s times of 18.1 and 18.0 seconds in consecutive weeks. If typical hand-timing variation is several tenths of a second, the difference may be indistinguishable from measurement noise. Repeated improvement from approximately eighteen to sixteen seconds under comparable conditions is more convincing. Even then, confirm course length and clock start definition.
Sporting relevance is not identical to statistical detectability. One tenth may decide a close event, but it must be measured accurately enough before attributing it to a technical intervention. Conversely, a two-second improvement may be obvious without changing placing when opponents remain much faster. Dashboards should reveal both magnitude of change and its potential competitive relevance.
Keep raw values and measurement-method labels. If timing changes from handheld stopwatch to electronic gates, record the transition instead of silently merging both series. Required precision depends on the question: general technical planning may tolerate rougher measures, while tight competition ranking analysis demands stronger timing procedures.
18. Missing data and failed attempts: preserve reality in full
A test not performed is not identical to a failed attempt, and an unfinished carry is not the same as a very slow completed run. If an athlete stops after twelve metres of Yoke, do not invent a twenty-metre time. Record achieved distance, reason for stopping when known and unavailable finishing time. This distinction allows later analysis without turning missingness into an artificial record or failure.
Maximal-event databases should preserve failed attempts, not only personal records. If an athlete attempts a 140 kg Log three times and succeeds once, «best successful weight 140» and «one valid lift from three attempts» provide different coaching information. In timed repetition events, attempted and accepted repetitions must also remain distinct. A success-only database creates overly optimistic expectations.
Imagine a session where Squat velocity is unavailable because a sensor battery failed. Preserve the fact that Squat occurred and mark only velocity missing. Entering 0 m/s would imply inability to move in many models. If suitable video exists, a separate estimate may be calculated with its own methods and uncertainty, but should not be silently treated as equivalent to the sensor output.
Missingness patterns also matter. If athletes fail to complete diaries mainly after unsuccessful sessions, recorded trends may be biased upward. Healthy monitoring encourages documentation of failures without judgement. In research and coaching, unsuccessful attempts are information rather than a source of statistical embarrassment.
19. Season phase: numbers have meaning only relative to the objective
The same result can carry different meanings in different phases. During accumulation, rising volume may be intentional even if a reference test becomes temporarily slower. During taper, reduced loading may be planned to allow better expression of existing capacity. A dashboard that automatically labels every tonnage decline regression does not understand the programme. Interpretation requires knowledge of what the coach was trying to develop.
Every session can carry a phase label: post-season recovery, accumulation, intensification, event-specific preparation, taper or competition. Labels can reflect the training system used, but must be defined. A recovery week cannot be judged by comparing its total kilograms alone with a maximal-volume week. Instead ask whether the planned change produced the expected response without undermining preparation continuity.
Imagine an athlete reducing Yoke runs from five to two during a recovery week. Session RPE falls and a reference run becomes slightly faster. These observations do not prove new structural adaptation; reduced acute fatigue could explain them. They may nevertheless support the hypothesis that programming allows the athlete to express existing capacity. Follow-up across subsequent weeks is necessary.
A useful system does not prescribe one periodisation philosophy. It may track conventional training blocks, frequent autoregulation or a competition-driven schedule. The requirement is preservation of programme intent and actual changes. Judging a whole plan from the last plotted point is rarely adequate.
20. Competition calendars and travel demands
Strongman frequently involves travel, long waits, unfamiliar implements and multiple events in one day. These exposures are not represented adequately by gym tonnage. A competition calendar should link to training records so travel, competition and recovery periods can be interpreted together. Sports-loading consensus considers factors including competition, travel and psychosocial demands relevant to overall load management [8].
For each competition, record date, location, event count, regulations, order, loads, successful and failed attempts and approximate travel duration. Do not automatically convert every hour of driving into an exact fatigue unit. Context notes may suffice. An athlete returning from overnight travel with low energy should not be compared uncritically with their ordinary rested training condition.
Imagine two competitions across three weekends. Between them, the coach reduces Deadlift volume and retains only a few technical Log attempts. A basic tonnage graph may show a major decline; a phase-aware system reveals an intention to preserve competitive performance. Data should help explain season strategy rather than automatically penalise any week without increasing load.
Across seasons, the calendar may support questions about recovery after different contest types and long journeys. Findings remain individual and observational. No universally guaranteed recovery duration follows from these records, but consistent documentation can improve planning for a specific athlete.
21. Workload summaries by movement family
Different calendar days can repeatedly stress similar movement patterns. Strict Press on Monday, Push Press on Thursday and Log on Sunday represent several overhead exposures despite different exercise names. Deadlift, Sandbag Pickup and Atlas share some lifting and stabilisation demands without being mechanically identical. Movement-family categories reveal weekly structure while preserving event-specific differences.
Possible families include pulls from the floor, lower-body extension, overhead pressing, loaded locomotion, object handling and accessory work. For each, record attempts or sets, loading and perceived difficulty where available. Do not add three Farmer’s runs to three Squat sets and call the result six units of universal stress. Use parallel summaries describing what actually occurred.
Imagine three overhead exposures, two pulling sessions and one demanding loaded-carry day in a week. If Log feels unexpectedly difficult on Sunday, overlapping overhead work deserves review, but is not proven to be the cause. Sleep, implement loading and technique could contribute. Classification generates a useful question rather than a diagnosis from category counts.
A movement-family calendar can display exposures with clear visual grouping. That may be easier to understand than an invented «total stress index» based on equations without evidence. The aim is to see whether similar demands were clustered intentionally and whether the distribution should be reconsidered.
22. Alert rules: distinguish measurement problems from sporting problems
Warning systems can help, but different issues need different labels. A timing error is not fatigue, and one rejected repetition is not automatically loss of strength. Alerts can identify missing or incomparable data, changes outside an athlete’s usual range and symptoms or control problems requiring attention. These should not collapse into one unexplained red light.
A quality alert might read «Yoke times are not directly comparable because the course changed». A statistical alert might state «the reference result is slower than its recent range; check conditions and normal variability». A safety-related prompt should encourage stopping unsafe testing and seeking appropriate assessment when important symptoms or loss of control occurs. That is not an automated diagnosis and should not depend merely on a readiness percentage.
Suppose Farmer’s time is eighteen percent slower than usual. If handles changed, the system should flag that before interpreting the result physiologically. If conditions match and the athlete reports unusual difficulty, the signal becomes more relevant. Yet an arbitrary threshold does not establish cause or independently predict injury risk.
Good alerts explain their trigger and can be dismissed with a documented reason after review. They direct coach attention rather than decide in the coach’s place. Too many false alarms require recalibration; failure to highlight obvious problems requires redesign. A useful traffic light is an interface for questions, not a verdict.
23. The main dashboard: four views instead of forty charts
A useful dashboard quickly answers four questions: what training occurred, what performance resulted, how did the athlete respond, and what needs checking? The first panel shows session distribution and load. The second follows a few standardised event results. The third covers selected subjective measures and perhaps one reference test. The fourth flags changed conditions, missing data and unresolved coaching decisions. Not every possible graph belongs on the home screen.
Use explicit units. Time is shown in seconds, load in kilograms, distance in metres, velocity in metres per second, and session RPE in arbitrary units. An undefined «fatigue 72%» display is less meaningful than a clear note that training felt unusually difficult. Every performance series should identify loading and relevant rules. A progression from 300 to 360 kg Yoke should not be plotted as though both results came from the same task.
In a hypothetical example, an athlete’s standard twenty-metre Yoke at 300 kg becomes a second faster over two months while demanding event exposure rises and session RPE stays approximately stable. This is promising, but the graph does not establish which training component caused the improvement. Describe the association and preserve its context.
A dashboard should allow users to inspect source values and video behind unusual points. Attractive presentation should not hide provenance. If a coach cannot quickly discover where a number came from, the dashboard may offer less value than a transparent spreadsheet.
24. Longitudinal graphs and the danger of false visual stories
Graphs reveal patterns obscured by long tables, but can also create misleading impressions. Two curves placed on different axes may look correlated merely because their scales were adjusted. An upward trend may result from different event conditions, while a sudden drop may be a transcription error. Graph interpretation requires the same discipline as raw-data analysis.
Connect observations only when protocols are sufficiently comparable and mark periods without testing. If an athlete did not perform Atlas for three months, do not imply the same test was continuously measured throughout that period. Leave gaps, label the return and document intervening changes. Competition, deload and apparatus annotations help explain context.
Imagine a Squat velocity graph rising after changing sensors. Without an annotation, viewers may infer progress. Different instruments may not produce interchangeable values. A dashboard can place a vertical change marker and avoid fitting one continuous trend across incompatible periods. The display remains useful without pretending measurement continuity.
Published graphs should identify whether outcomes are real or hypothetical and whether shaded bands represent dispersion, confidence or prediction. Error bars must not be invented for decoration. The reader should understand both the supported conclusion and the important alternatives that remain possible.
25. Weekly review: a routine that produces an actual decision
At the end of each week, a coach can review planned versus completed load, reference performance and athlete-reported state in a fixed order. There is no need to inspect every video or repetition unless a specific question warrants it. A ten-minute routine can reveal major changes, leaving detailed analysis for cases where it adds value. Effective monitoring reduces administrative burden while preserving disciplined interpretation.
Start with data quality: are results missing, protocols different or timestamps suspicious? Next compare performed work with the plan. Then review the athlete’s subjective response and repeatable reference tests. Finally make a modest decision: maintain the coming week, redistribute a session, practise a transition or wait for more evidence. This sequence reduces overreaction to one isolated number and distinguishes observation from intervention.
Imagine increasing overhead volume while Log for Reps remains at seven valid lifts and session RPE rises. The programme has not been demonstrated to fail. We can record that familiar performance now carries greater perceived cost and check whether it persists. If recovery indicators also deteriorate, there is greater reason to reconsider the loading distribution, still without inventing a medical diagnosis.
Every review should leave a decision record: date, observation, action, rationale and planned reassessment. Otherwise a coach may change programming repeatedly without knowing which interventions helped. A Data Lab becomes educational when it preserves the history of decisions as well as kilograms.
A final check is whether the selected metric genuinely influenced the decision. If a report contains twenty indicators but the coach uses only two, collection should be simplified or the purpose of the unused measures reconsidered. Sustainable routines are more valuable than elaborate weekly reports that become impossible to maintain.
26. Monthly review: distinguish a good week from durable progress
One session can be influenced by day-to-day state, technique or measurement error. Monthly review allows multiple observations to be considered against phase objectives. During hypertrophy, tolerance of planned volume may matter; near competition, specific event outcomes may become more important. Every month should not be evaluated through the same simplistic rule of heavier weights always being better.
A concise report may show standardised Yoke time, valid repetition count at fixed loading, exposure by movement family and repeated technical or subjective issues. However, aggregation must respect sparse observations. A mean from two carries is less convincing than a consistent history of ten comparable runs. Include observation counts and note changed equipment or rules.
Imagine improvement in the last three Farmer’s tests while Atlas results remain stable. The defensible conclusion is improvement under the Farmer’s protocol, not uniform development across the entire sport. If the month’s central objective was loading proficiency, unchanged Atlas results may deserve attention despite success elsewhere. Analysis needs to reflect the athlete’s actual priorities.
Close the month by asking what will be retained, changed or measured more carefully. Do not automatically replace exercises when one trend temporarily flattens. Development may follow different timescales and require consolidation. Longitudinal analysis disciplines interpretation rather than guaranteeing constant improvement.
Monthly reports can also evaluate the monitoring process itself. Were fields regularly missing? Did the camera angle change unexpectedly? Did feedback lead to a practical training decision? A system that learns from its own collection mistakes can become more reliable even during a month without competitive records.
27. Prediction models: start with a mean before adding complexity
When enough comparable outcomes are available, forecasting the next performance may become useful. But the first model should be simple and transparent: the last result or mean of the last few trials. Forecasting literature emphasises comparison against baseline approaches and evaluation on future observations [10]. A complex algorithm that does not outperform this benchmark on real predictions has not automatically earned practical value.
For standardised Yoke, calculate the mean of the last three runs and save it before the next test. After the run, compare forecast and outcome, then repeat. This creates a history of genuine prediction errors rather than a curve that merely reproduces past data. Regression, exponential smoothing or machine learning may be added when they demonstrate relevant improvements on new attempts.
Consider hypothetical times of 20.1, 19.8 and 19.5 seconds. Their mean is 19.8 seconds. A more elaborate statistical model predicts 18.7. If the next run is 19.9, the simple mean performs better on that occasion despite the advanced forecast sounding more exciting. One trial does not settle overall superiority, but explains why continued evaluation matters.
Forecasts should specify load, distance, rules, horizon and uncertainty. If evidence cannot support a reasonable estimate, state that clearly. A cautious interval or admission that an event differs too much from historical tests may be the best available answer. Predictive honesty is more useful than forcing a precise number from every spreadsheet.
The same approach applies to repetition events. A simple forecast of the recent typical count may outperform a model fitted to many wearables, especially if the latter uses a tiny dataset. Only actual out-of-sample results can establish whether the added predictors improve decisions.
28. Model evaluation: the future must remain unseen during development
Predictive models can appear unusually accurate when they indirectly access the outcomes they claim to forecast. Randomly splitting a chronological diary or using variables calculated after competition creates this problem. Forecast models need time-respecting development and evaluation. Rolling-origin methods repeat prediction and updating across several chronological points [10].
Imagine twenty Deadlift for Reps tests. Use the first ten to forecast the eleventh, then the first eleven to forecast the twelfth, and continue. Save each prediction before its corresponding result is known. Collected errors can be summarised through MAE or another appropriate metric and compared with a simple baseline. Do not retrospectively modify incorrect forecasts or evaluate the final model solely on data used to choose it.
This discipline becomes particularly important when an athlete competes often but in different events. A Deadlift predictor does not become valid for Truck Pull merely because both results appear in the same database. Each outcome has its own structure and cross-event transfer requires evidence. With only three comparable competitions, accuracy estimates are very uncertain; publishing «98% accuracy» would be misleading.
Prediction quality and decision value should also be assessed separately. Reducing mean Yoke error from one second to nine-tenths may or may not improve programming. The difference might matter in a close contest or be irrelevant for a broad preparation decision. A functioning Data Lab prefers tools that provide demonstrable benefit.
The evaluation record should also identify model version and input availability. A forecast cannot be meaningfully assessed if it is silently recalculated after the result has occurred. Preserving the original prediction is the forecasting equivalent of preserving raw training data.
29. Prediction intervals: future outcomes have variability
A forecast of 19.6 seconds for Yoke can provide a useful central reference without describing the full range of plausible results. A prediction interval aims to represent variability of a future individual observation, not merely uncertainty in the estimated mean. It requires an appropriate calculation method and evaluation against later outcomes. Displaying an arbitrary «±5%» simply because it looks professional is not enough.
For illustration, imagine a model predicting 19.6 seconds with a hypothetical interval of 18.0 to 21.5 seconds. This is not claimed to be calibrated for any real athlete; it demonstrates the communication principle. If two contest strategies differ in expected time by only two-tenths, such a broad interval does not justify a categorical recommendation. If the question is whether an athlete can finish within sixty seconds, the same forecast may be informative.
Log for Reps produces integer scores. An expected value of 7.6 does not mean an athlete can achieve six-tenths of a valid repetition. Present plausible integer outcomes when the data support them. Without enough observations to calibrate probabilities, avoid precise-looking success percentages that cannot be justified.
Interval calibration can be assessed through the proportion of future outcomes falling within the ranges. If purported ninety-percent intervals repeatedly cover far fewer results, the model is overconfident or conditions have changed. An honest system can become more cautious as evidence reveals how much it does not know.
Intervals should not be treated as guarantees. Rare equipment problems, competition disruptions or genuine exceptional performances may produce results beyond them. Good forecasts communicate uncertainty rather than pretending they can eliminate every unexpected outcome.
30. Competition scenarios: personal data alone do not determine ranking
Competition placing depends on other athletes’ results and scoring rules. An eighteen-second Farmer’s run may win one event and place much lower at another contest. Forecasting personal time does not automatically forecast points. A meaningful simulation requires information about opponents, tie-breaking rules and implement conditions, all of which carry uncertainty.
A simple tool may use conservative, central and favourable scenarios for each event, then apply known rules. These scenarios are not calibrated probabilities unless supported by appropriate evidence. With limited opponent data, the final order remains uncertain. Nevertheless, scenarios can identify tactical thresholds: how many extra repetitions might move an athlete up one place?
Consider a hypothetical five-athlete contest awarding five points for first through one for fifth. Placings of first, fourth, second, fifth and third yield 5+2+4+1+3 = 15 points. Different organisers may use other points systems or tie procedures. Software ignoring actual regulations can produce poor decisions despite correct arithmetic.
Strategy also involves the cost of extra attempts. A failed maximal Log lift might influence capacity later in the contest, but static rankings do not automatically estimate that cost. Safety, athlete experience and real event conditions remain central. Statistical modelling should inform tactics rather than replace competent judgement.
When competition results become available, compare predictions with reality and note which assumptions were incorrect. If ranking estimates consistently overvalue one event, revisit opponent data and event-specific uncertainty. The best simulator is one that can be tested and improved rather than defended as infallible.
31. Decision logs: the forgotten variable in most monitoring systems
A system can measure training accurately yet learn nothing about whether its own recommendations were useful. When a coach reduces volume after a hard week, revises Farmer’s starting technique or adds Log-specific drills, the decision and its rationale should be recorded. Otherwise, after six months it becomes difficult to distinguish coherent programming from intuitive changes made day by day. A decision log turns monitoring from storage into learning.
A decision record needs only a few fields: date, triggering observation, alternative considered, selected intervention, intended duration and outcome to evaluate. For example: «Yoke loses time over the final five metres; test a more controlled start for three sessions; assess late split time and frame control». This is a testable hypothesis, not a certainty that the new technique will succeed.
Imagine the new strategy producing faster times in two of three sessions, with one unchanged and no invalid attempts. There is a practical reason to continue testing, but three runs do not demonstrate a definitive causal relationship. A coinciding deload or different apparatus would complicate interpretation further. The important point is that the decision existed in the record before its outcome became known.
Decision logs also reduce retrospective overconfidence. A coach may discover that some attractive adjustments achieved little while less dramatic ones were useful. Evaluating the full history, not only success stories, makes data-informed practice more credible. This learning process is valuable even when the model remains simple.
The log should also make decisions understandable to athletes. When training changes, they deserve to know what was observed, what uncertainty remains and how the change will be judged. Transparent reasoning can build better cooperation than an unexplained app notification instructing them to lift less or more.
32. Autoregulation: an informed adjustment is not necessarily an automated one
Autoregulation changes aspects of training according to information about athlete state and execution. It may use RPE, fixed-load velocity, technical quality or short reference tests. But adjustment is not the same as surrendering every load choice to software. A metric can change because of apparatus, technique, measurement error or daily conditions; the programme’s objectives still matter.
A cautious protocol starts with questions instead of universal thresholds. Is the reference test comparable? Are relevant symptoms present? Has perceived exertion changed? Is today intended for technical quality, accumulation or heavy attempts? If several observations suggest reduced readiness, a coach may lower loading or volume, but no one percentage reduction suits every case. On other days, retaining the original plan may be the best decision.
In a teaching example, an athlete plans ten submaximal Push Press singles after a demanding competition and reports unusual fatigue. Reference performance is slower, but video also reveals a technical change. Before concluding physiological deterioration, examine execution and context. A reduced technical session may be reasonable; another maximal test is not automatically required.
Autoregulation rules should be judged by their outcomes. Did adjustments support continued development? Did they help preserve control? Did they produce excessive changes in response to random noise? When an algorithm overreacts to every fluctuation, simplify it. The athlete’s progress matters more than obedience to the dashboard.
An effective system also permits a justified human override. If a sensor gives an implausible result because it slipped during a repetition, the coach should not be forced to follow the resulting alert. The override can be recorded with its reason and reviewed later. Accountability should increase, not decrease, as automation becomes more common.
33. Case study: a complete week in Strongman Data Lab
Imagine an athlete completing five sessions: Monday overhead, Tuesday Squat and accessories, Wednesday back work, Saturday Farmer’s and Yoke, and Sunday Log, Atlas and Deadlift. This is an entirely constructed example rather than an individual prescription. Each day becomes one session record and each event attempt links through an identifier. External loads, repetitions, times and perceived session difficulty remain distinguishable rather than being forced into one mechanical unit.
On Monday the athlete performs Strict Press, five sets of six at 80 kg, reporting session RPE 6 over ninety minutes, giving 540 AU. Tuesday includes Squat, five sets of five at 160 kg, with one hundred minutes at RPE 8, giving 800 AU. Wednesday lasts seventy-five minutes at RPE 6, giving 450 AU. Saturday has three twenty-metre Farmer’s runs and three Yoke runs, with one hundred twenty minutes at RPE 8, giving 960 AU. Sunday is one hundred ten minutes at RPE 8, giving 880 AU. The illustrative weekly internal-load sum is 3,630 AU.
That total does not quantify actual fatigue or injury probability. Distribution and exercise content remain essential. Saturday Farmer’s times at 110 kg per hand are 17.2, 17.5 and 18.1 seconds, while 320 kg Yoke times are 19.0, 19.7 and 20.3. Slowing is visible within the session, but may reflect incomplete recovery, technique variation or accumulating effort. Video can reveal whether corrections or pauses accompany the change.
On Sunday the athlete completes six valid Log repetitions with one rejected effort. Store seven attempts and six acceptances, with phase timestamps where available. The weekly report may conclude that the weekend felt difficult and carry times slowed during repeated runs. It cannot diagnose a condition or establish a definitive causal mechanism from one week.
The coach could choose to keep the plan, change rest intervals or distribute heavy carries differently, depending on the block’s purpose. Whatever the choice, record it and specify how the following week will be evaluated. A complete Data Lab does not end its work when the weekly arithmetic is finished.
34. Case study: eight weeks of progress without exaggerated interpretation
Extend the example across eight weeks. The athlete performs a standardised twenty-metre Yoke test at unchanged loading, recording 21.4, 21.0, 20.8, 20.5, 21.2, 20.3, 20.0 and 19.8 seconds. These values are hypothetical. The broad trend is improvement, but week five contains a slower result. Plotting only the first and last observations would conceal that variation and create a false picture of perfectly linear progress.
If week five followed a competition and long travel, that is a plausible contextual explanation, not a demonstrated cause. If session RPE was higher too, slowing coincided with increased perceived demand. We cannot claim travel caused exactly 0.7 seconds of time loss. Such an inference requires comparisons and consideration of other factors.
The reduction from 21.4 to 19.8 seconds is 1.6 seconds, approximately 7.5% of the initial time. This does not translate automatically into a 7.5% strength increase or a proportional reduction in injury risk. Was pickup faster, frame sway lower or pacing different? Video can help narrow explanations, while future tests may assess them. Without additional evidence, improved completion time under this protocol is the justified conclusion.
A second event might show a different pattern. Imagine Log for Reps remaining stable at six accepted lifts. This mixed outcome illustrates that strongman development is not uniform across disciplines. A monitoring system must accommodate different rates of change without labelling the entire programme a failure. Multidimensional performance resists one-number summaries.
Across these weeks, it would also be sensible to review whether test conditions truly remained stable. A changed course marker, altered Yoke height or different timing system could mimic improvement. Longitudinal analysis is only as convincing as its underlying measurement continuity.
35. Case study: a technical incident and the difference between alert and cause
Imagine an athlete dropping the left Farmer’s handle after fifteen metres, increasing final completion time substantially. A system comparing only time with the recent mean may display «severe performance decline». Video reveals a more specific event: implement loss. Store it as a drop alongside mass, handle texture, surface and attempt order. One slow carry does not establish a decline in general maximal strength.
If the athlete reports grip difficulty, grip handling may plausibly have limited performance. But the reason could be local fatigue, moisture, a new handle or another factor. Software declaring «weak forearm muscles» would go beyond the observation. A controlled submaximal handling test might be considered when safe and consistent with the programme, rather than automatically adding uncontrolled volume.
Keep both final time and drop status. Rules may treat implement loss differently, particularly when pickups after dropping are forbidden or penalised. An attempt with a drop should not be compared uncritically with an uninterrupted run as a pure measurement of travel velocity. Outcome validity and physical movement have to remain separate variables.
A useful alert therefore says «unusually slow completion with documented implement drop», not «athlete is overtrained». The distinction makes monitoring more accurate and responsible. An intelligent system is one that prevents unjustified interpretation, not merely one that highlights large numerical deviations.
There may be a worthwhile technical response, but it should be tested rather than presumed. If handle positioning is revised and later runs become more reliable, retain the evidence. If drops continue, reassess the explanation. The alert initiates investigation; it is not a final diagnosis.
36. Evaluating interventions: success, no clear effect or unwanted consequences
After a technical or programming adjustment, assess whether the targeted marker changed and whether the complete event improved. Suppose an athlete practises a more controlled Yoke start. The first five metres become slightly slower, but the final fifteen metres are more consistent and total finishing time improves. A system tracking only opening acceleration might incorrectly label the intervention unsuccessful despite the primary outcome improving.
In another case, the Log clean becomes faster but the athlete rejects more presses because the rack position is unstable. Improvement in one phase does not automatically mean improvement in the entire event. Track accepted repetition count, overall time, invalid attempts and technical control together. A Data Lab should not reward every second saved if competition validity is sacrificed.
Data may also show no clear effect. If results remain within ordinary test variation across four sessions, there may be insufficient evidence that the adjustment works. That does not necessarily mean the technique is useless; more practice, a different outcome measure or a more reliable test may be needed. But do not claim success when the evidence fails to establish it.
An intervention improving a performance number while creating discomfort or prolonged recovery problems deserves reconsideration. The system must record benefits and potential costs. Sustainable performance cannot rely on systematically ignoring adverse effects because the primary chart is rising.
The final report should distinguish observed association from causal proof. A small practical before-and-after experiment can support coaching judgement without establishing a universal law. When feasible, repeated comparable trials and a clearly specified decision criterion help the evaluation become more informative.
37. The first month: getting started matters more than perfection
Week one is for field definitions and collection testing, not predictive modelling. Choose a few representative exercises, identify apparatus and establish timing rules. Record each session in a simple table and check that the athlete can complete it without undue difficulty. If data entry takes fifteen minutes after every workout, the system may be too complicated for consistent use. Aim for a process sustainable over months rather than an impressive dataset abandoned after several days.
During week two, add one reference test and a brief status questionnaire. Keep loading, event rules and camera view comparable when relevant. Check how often values are missing and whether the athlete understands the response scales. Two weeks do not permit precise conclusions about sleep and performance. They establish the records needed to ask better questions later.
Week three introduces structured review: what occurred, what changed, which results can be compared and which cannot? If Yoke time slows, confirm the course and frame before discussing physiological reasons. When conditions differ, label the change. A modest programming adjustment may be considered, but its rationale should be recorded before the next result is known. Data begin to support accountable decisions.
In week four, improve the process itself. Remove unused fields, clarify definitions that produce disagreement and decide how videos are named and stored. Four weeks are not enough to validate a complex predictive model robustly, but they can show whether the system is practical, coherent and capable of retaining observations without obvious errors.
The first month should end with a procedure the athlete understands rather than a dashboard full of mysterious indicators. If a variable cannot be explained in ordinary sporting terms, reconsider whether it belongs in the daily routine. A system athletes willingly use will often provide better longitudinal evidence than an elaborate protocol they avoid.
38. The first three months: from logging to meaningful comparison
After month one, the priority becomes consistent collection of comparable observations. Month two preserves reference protocols and begins simple trend visualisation without assigning causality to every fluctuation. Month three examines whether chosen indicators matter for training objectives and whether the decisions based on them were useful. This progression avoids premature investment in elaborate infrastructure.
For an athlete preparing Farmer’s and Yoke, a small number of appropriately scheduled reference runs may provide information without added maximal testing. Exact frequency depends on season phase and recovery. Frequent competitors should not undertake heavy extra attempts simply to generate more points for a graph. Ordinary training can supply useful observations when execution and rules are sufficiently consistent.
Imagine eight comparable Yoke runs and ten Log sets after three months. This is not a large sample, but may help describe familiar variation and start evaluating very simple forecasting rules. If the eight Yoke runs actually involved three different frames, the relevant count for any apparatus-specific model is smaller. The distinction should influence analysis before algorithms are selected.
At the quarter’s end, ask more than whether lifts improved. Did the athlete record reliably? Were entries accurate? Could the coach quickly identify invalid comparisons? Did monitoring change any decision constructively? These criteria assess the maturity of the monitoring process rather than merely the athlete’s force-producing ability.
A useful early success is recognising that a once-important metric should be removed. For example, if a subjective score is consistently misunderstood or never informs planning, simplifying the questionnaire may improve the project. Data maturity includes the willingness to abandon low-value measures.
39. Scaling from one athlete to a team
Shared systems introduce new challenges: access permissions, protocol differences and responsibilities for entering or correcting information. Coaches may need broad performance overviews, but teammates do not need access to one another’s personal well-being records. Interfaces should support access proportionate to each person’s role and the legitimate monitoring purpose.
Use unique athlete identifiers and maintain individual baselines. Do not automatically judge one person’s recovery against another’s HRV values or define «good RPE» from an arbitrary group average. Measures have personal distributions and contextual meanings. Cross-athlete comparisons may be useful for the same competition task, but equipment, rules and relevant physical differences must be accounted for.
A data coordinator may review metadata, a coach may interpret technical results and athletes provide subjective context. In a small club, one person may hold several responsibilities, but these still need definition. Who corrects a wrong time? Who validates official competition results? Who approves public release of a video? Unclear responsibility creates both error and unnecessary privacy risk.
Well-organised team data may reveal patterns unavailable in one diary. Yet more athletes do not repair incompatible apparatus or regulations. Before calculating group means, confirm that records actually describe comparable tasks. Interoperability is a methodological achievement, not merely the technical ability to merge files.
Teams should also record when individuals use different reference tests for good reasons. Personalisation can coexist with shared database fields. The goal is not to force everyone into one protocol regardless of safety, training level or competition requirements, but to preserve clear definitions so relevant comparisons remain possible.
40. Technical architecture: spreadsheet, relational database or CMS?
An individual athlete can begin with a spreadsheet containing session, attempt, apparatus and result sheets. Its strengths are accessibility and easy correction. Limits arise with simultaneous editing, complicated relationships or hundreds of video files. There is no need to design an international federation platform on day one, but stable identifiers and naming conventions make eventual expansion easier.
A relational database can later link attempts to athletes, sessions and implements through keys. Separate file storage contains videos while the database keeps paths and metadata. A dashboard displays results calculated from those records. When a content management system publishes articles, editorial material should ideally remain logically separate from private training records. Publishing a conclusion does not require copying an entire sensitive athlete diary into a public article collection.
For a project such as VladimirStrongman, a CMS can manage public scientific articles, profiles and educational resources while sensitive performance records remain in appropriately controlled storage. No specific provider automatically resolves every analytical or security need. Architecture must follow data types, permission requirements and workflow rather than software branding.
Distinguish collection, storage, transformation and presentation layers. Updating a prediction algorithm should not alter raw observations. Redesigning the website should not erase the data dictionary or break historical references. This separation improves longevity and reduces dependence on any one application.
A phased technical approach also makes costs more predictable. The first version needs little beyond disciplined data capture, while greater automation should be purchased or built only when it reduces demonstrable workload or improves data quality. Expensive architecture without reliable source records is a poor investment.
41. Imports, exports and preservation of raw history
Over time, information may arrive from spreadsheets, timing applications, sensors, forms and videos. Every import should preserve source identity, processing date and an appropriate validation procedure. One file may use kilograms, another pounds; the conversion must be explicit and controlled. Velocity exported in metres per second must not be mistaken for kilometres per hour because both columns are generically labelled «speed».
Preserve an unmodified copy of original source data and work on processed versions for analysis. When an error is discovered, corrections can be checked against the original and documented. A revision history avoids the situation where one carry has three incompatible times with no explanation. Losing raw files makes subsequent verification difficult or impossible.
Usable exports need field definitions and identifiers. A CSV or JSON file with columns called «A», «B» and «C» but no units or metadata is not meaningful interoperability. A data dictionary and source documentation are as important as file format. The FAIR principles offer a useful framework for thinking about structured, reusable data [9].
Backups should be periodic and verifiable. Do not assume a cloud account will preserve everything indefinitely. Test restoration and identify who maintains the archive. Continuity depends partly on simple administrative habits rather than sophisticated computation.
When data are transferred to collaborators, export only what is necessary for the agreed purpose. A shared analysis of Yoke timing should not automatically expose unrelated personal notes. Keeping source, processed and publishable datasets distinct can reduce accidental disclosure and make revision easier.
42. Athlete privacy is an architectural requirement
A Data Lab may contain sleep, stress, pain, personal schedules, travel and identifiable videos. These data should be collected proportionately and protected by appropriate permissions. A coach does not need unrestricted access to private life to follow Farmer’s times. Athletes should understand who can see each kind of information, why it is collected and how long it is retained.
Public publication must be distinguished from internal coaching. A video supplied for technical feedback is not automatically authorised for an article or machine-learning training. Consent to recording, analysis and distribution may be separate. Competition footage also requires appropriate attention to usage rights and event rules.
Imagine a team publishing an educational analysis of Yoke progress. It can use aggregated findings, explicitly hypothetical examples or records from athletes who have authorised such use, accompanied by transparent methods. It need not disclose private health information to make the graphic compelling. Good scientific communication does not require excessive personal exposure.
International projects may face differing legal obligations for personal-data processing. This technical article does not replace legal advice. The operational principles are to minimise collection, store data securely and establish clear procedures for authorised access, correction, export and deletion when applicable. A system without athlete trust will eventually receive worse information.
Privacy also affects the quality of subjective reporting. When athletes fear that a sleep score or pain note will be public or judged unfairly, they may underreport problems. Respectful governance is therefore not only an ethical requirement but a practical condition for obtaining useful data.
43. Evaluating the whole Data Lab: the system should measure its own usefulness
A monitoring system ought to accept evaluation of its own performance. Every three or six months, ask how complete the data are, how many errors needed correction, how often alerts proved misleading and how many coaching decisions were subsequently reviewed. Spectacular charts that nobody uses for planning do not demonstrate success. Value comes from better decisions, not the number of installed sensors.
Useful operational metrics include the proportion of recorded sessions, percentage of attempts with identified apparatus, share of videos correctly linked to attempts and time required to prepare the weekly report. These describe process quality, not athlete fitness. If forty percent of Farmer’s runs lack per-hand mass, the central problem is the collection form rather than the prediction algorithm. Improving data entry may produce greater methodological gains than adding another statistical model.
For coaching decisions, examine whether documented interventions were followed by relevant improvement in comparable tests, while respecting limitations of observational inference. Do not automatically assign causal credit. If alerts repeatedly caused unnecessary load reductions because they overreacted to noise, simplify them. If the system uncovered a recurring timing error, that is also a worthwhile achievement.
A mature Data Lab is willing to discover that some of its own ideas do not work. Measurement is valuable precisely because it can correct expectations, including coaches’ expectations. Honestly revised procedures are better than a dashboard that continually advertises success while hiding mistakes. The same discipline should govern athlete progress and tool evaluation.
A particularly important metric is athlete adherence to the recording process. When completion falls, investigate whether the system is burdensome, confusing or perceived as intrusive. Missing information may reflect poor workflow rather than poor athlete commitment. Improvements in usability can strengthen scientific quality.
44. Case study: from initial records to the decision before competition
Imagine an athlete beginning the off-season with a modest database: Squat, Deadlift and Strict Press in a spreadsheet, several Farmer’s times, two Yoke videos and a session-RPE diary. During month one, labels are standardised and reference tests selected. Over subsequent months, Yoke split landmarks and Log phase definitions are introduced without changing programming solely because software permits new measurements. Each week the coach reviews results and records decisions; each month the longer-term trend is examined.
After three months, hypothetical data show four comparable Farmer’s twenty-metre tests at 110 kg per hand becoming faster, while 320 kg Yoke results remain variable. Yoke videos repeatedly show difficulty controlling the frame late in the course. Athlete and coach choose to test a more controlled start at manageable loads with unchanged rules. They do not simultaneously alter ten training variables, because doing so would obscure which change contributed to the outcome.
After several additional sessions, late Yoke splits become more consistent and total completion time improves modestly. The result is promising but does not establish that the technique is universally optimal. It has been tested under limited conditions and needs evaluation against the upcoming contest’s apparatus and rules. Meanwhile, overhead sessions feel increasingly demanding, creating a separate reason to discuss load distribution before competition.
Two weeks before the event, the athlete can view event times, recent loading, relevant videos and cautious performance ranges on one screen. If Yoke suggests roughly nineteen to twenty-one seconds under the standardised protocol, that may guide pacing without guaranteeing performance. If Atlas has only two recent observations, a precise forecast would be unjustified. The athlete remains free to adapt tactics to real competition circumstances. The system informs rather than dictates.
After competition, the loop closes. Official results are compared with pre-event estimates, event-specific errors are recorded and unforeseen conditions documented. This follow-up transforms the contest into another source of learning without pretending that all outcomes were predictable in advance.
45. Essential limitations: strongman is not a perfectly controlled laboratory
The central challenge is comparability, not arithmetic. Events differ between contests, implements change, athletes have different morphologies and some attempts cannot be repeated without substantial recovery costs. Direct strongman biomechanics research remains much smaller than the literature on conventional resistance exercises [1]. General formulas from other sports should not therefore be presented as validated for every strongman event.
Relationships between training load and fatigue are complex and do not support diagnoses from one score. Halson discussed the challenges of athlete fatigue monitoring [3], while critiques of the acute:chronic workload ratio highlighted dangers in overinterpreting derived indices [13]. A ten-percent load increase does not automatically imply a ten-percent injury-risk increase. No stopwatch can independently establish a medical condition.
Statistical forecasts are likewise constrained by small datasets, changing conditions and selection of attempts. A Yoke model built on a straight course may fail when competition introduces turns. A pose-estimation algorithm validated on an unobstructed Squat is not automatically accurate with Atlas Stones. Computation can amplify both signal and measurement error when methods lack context-specific validation.
These limits do not make monitoring pointless. They clarify priorities: official outcomes, clearly documented conditions, comparable attempts and transparent execution observations. When a cause cannot be identified, change can still be described accurately. Applied science does not require absolute certainty; it requires claims proportionate to available evidence.
An especially important limitation is the difference between individual learning and population evidence. An intervention may work repeatedly for one athlete without establishing its value for everyone. Conversely, a group average may fail to represent a competitor with unusual technique or event history. Individualisation and wider research should inform one another without being conflated.
46. Publishing research and articles: transparency is part of performance
A strongman education project can publish analyses, case studies and research syntheses, but it must distinguish real measurements from constructed examples. If an article displays eight weeks of data, readers should know whether the values come from consenting athletes, a published study or a hypothetical scenario. Teaching numbers must not be presented as conducted experiments, and observations should not be assigned to identifiable competitors without evidence and proper permission.
A scientific report should specify its objective, sources, operational variable definitions, equipment, observation count, processing method, handling of invalid attempts and limitations. Reporting standards developed elsewhere, including TRIPOD+AI for prediction models [11], illustrate the importance of transparent methods. They are not presented as official strongman requirements. Their transferable lesson is that readers should understand how a conclusion was generated and whether it was tested on data unused during development.
Bibliographies must distinguish direct strongman research from general statistical methods. Hindle and colleagues provide event-specific biomechanical context [1], while Hyndman and Athanasopoulos address general time-series forecasting methodology [10]. Applying these principles to Yoke or Farmer’s is a declared extrapolation, not automatically a finding already established in strongman athletes. Long reference lists cannot substitute for explaining the distinction.
Publication also requires respect for image and video rights and athlete confidentiality. Search-engine-friendly titles can improve access, but should not promise infallible prediction or treatment of health conditions. Credibility grows through traceable information, clear explanation and willingness to correct errors, rather than exaggerated certainty.
A useful editorial habit is to separate «what the study found», «how this might apply to strongman» and «what remains unknown». These may appear in connected paragraphs rather than rigid lists, but readers should always be able to identify them. Scientific accessibility means making the argument understandable without erasing its uncertainty.
47. From ten episodes to a functioning platform: development directions
A realistic next step is a diary template with event-specific fields and a shared chronology. Then a video library can add timestamps and technical landmarks. A simple dashboard can display reference outcomes, training load and recent decisions. Prediction models should only be introduced when enough comparable observations exist for chronological evaluation. This sequence keeps technological investment proportionate to demonstrated usefulness.
For a project such as VladimirStrongman, the framework could support educational articles, examples of event analysis and practical learning tools for Romanian competitors. Public editorial material can explain the method while private athlete diaries remain protected. If multiple athletes voluntarily use a common protocol, aggregate information about event variability may become available, provided methods, permissions and limitations are transparent.
Future research may investigate video timing validity during competition, between-implement differences and whether submaximal references help predict results under competitive loads. Longitudinal analysis documenting unsuccessful models would be particularly valuable. A mature platform can support such work by preserving original records and collection metadata. It cannot automatically turn club observations into controlled clinical studies.
The most valuable long-term outcome may be a shared language for strongman measurement: consistent start definitions, clear distinctions between accepted and failed attempts and disciplined reporting of uncertainty. Communities collecting compatible data can test questions that one athlete or club cannot address alone. The ambition should begin modestly, with clear protocols and respect for those supplying data.
There is room for innovation without presenting technology as an end in itself. Better timers, low-cost sensors and accessible video tools may reduce collection burden. Yet each tool should be assessed for actual validity, reliability and usefulness. The future of Strongman Data Lab is not determined by how many algorithms it contains, but by how carefully it integrates evidence with sporting practice.
48. Conclusion: measurable performance does not replace the athlete
The series began by asking what measurable performance means in strongman. The final answer is neither a readiness percentage nor an algorithm claiming to know the next contest exactly. Performance becomes meaningfully measurable when the target is defined, the conditions are known, comparisons are sufficiently reliable and the result can inform a decision. From maximal Deadlift to Farmer’s, Log for Reps and Atlas Stones, methodological discipline must adapt to the distinct event.
The complete system connects results, apparatus, courses, sessions, athlete-reported state, videos and interpretations without confusing them. It preserves raw observations, notes uncertainty, documents protocol changes and permits return to source material. Failed attempts are not hidden and unperformed tests are not manufactured. Forecasts are evaluated against genuinely new outcomes, while interventions are reviewed for whether they actually helped.
Strongman becomes no less compelling when it is measured. Behind twenty metres under enormous loading lie technique choices, pacing, recovery and adaptations worth understanding. A contest result can be emotionally powerful while still being analysed rigorously. Science does not replace experience beneath the bar; it offers a means for that experience to be communicated and tested.
This is the purpose of STRONGMAN DATA LAB: not a factory of numbers, but a system helping athletes and coaches ask sharper questions, avoid unjustified certainty and build progress through consistent observation. Ten episodes conclude here, yet the method begins again with the next correctly recorded workout, the next careful comparison and the next decision evaluated against reality.
The greatest achievement of a complete monitoring system is not predicting every repetition or eliminating uncertainty. It is helping a competitor understand what can be known, what remains uncertain and which next step is worth testing. That is a practical standard of intelligence that no dashboard can deliver unless the people using it retain their judgement.
Scientific bibliography
[1] Hindle, B. R., Lorimer, A., Winwood, P., & Keogh, J. W. L. (2019). The Biomechanics and Applications of Strongman Exercises: A Systematic Review. Sports Medicine - Open, 5, 49. https://doi.org/10.1186/s40798-019-0222-z
[2] Bourdon, P. C., Cardinale, M., Murray, A., et al. (2017). Monitoring Athlete Training Loads: Consensus Statement. International Journal of Sports Physiology and Performance, 12(Suppl 2), S2-161–S2-170. https://doi.org/10.1123/IJSPP.2017-0208
[3] Halson, S. L. (2014). Monitoring Training Load to Understand Fatigue in Athletes. Sports Medicine, 44(Suppl 2), 139–147. https://doi.org/10.1007/s40279-014-0253-z
[4] Foster, C., Florhaug, J. A., Franklin, J., et al. (2001). A New Approach to Monitoring Exercise Training. Journal of Strength and Conditioning Research, 15(1), 109–115. https://pubmed.ncbi.nlm.nih.gov/11708692/
[5] Saw, A. E., Main, L. C., & Gastin, P. B. (2016). Monitoring the Athlete Training Response: Subjective Self-Reported Measures Trump Commonly Used Objective Measures: A Systematic Review. British Journal of Sports Medicine, 50(5), 281–291. https://doi.org/10.1136/bjsports-2015-094758
[6] Weakley, J., Mann, B., Banyard, H., McLaren, S., Scott, T., & García-Ramos, A. (2021). Velocity-Based Training: From Theory to Application. Strength & Conditioning Journal, 43(2), 31–49. https://doi.org/10.1519/SSC.0000000000000560
[7] Atkinson, G., & Nevill, A. M. (1998). Statistical Methods for Assessing Measurement Error (Reliability) in Variables Relevant to Sports Medicine. Sports Medicine, 26(4), 217–238. https://doi.org/10.2165/00007256-199826040-00002
[8] Soligard, T., Schwellnus, M., Alonso, J. M., et al. (2016). How Much Is Too Much? (Part 1) International Olympic Committee Consensus Statement on Load in Sport and Risk of Injury. British Journal of Sports Medicine, 50(17), 1030–1041. https://doi.org/10.1136/bjsports-2016-096581
[9] Wilkinson, M. D., Dumontier, M., Aalbersberg, I. J. J., et al. (2016). The FAIR Guiding Principles for Scientific Data Management and Stewardship. Scientific Data, 3, 160018. https://doi.org/10.1038/sdata.2016.18
[10] Hyndman, R. J., & Athanasopoulos, G. (2021). Forecasting: Principles and Practice (3rd edition). OTexts. https://otexts.com/fpp3/
[11] Collins, G. S., Moons, K. G. M., Dhiman, P., et al. (2024). TRIPOD+AI Statement: Updated Guidance for Reporting Clinical Prediction Models That Use Regression or Machine Learning Methods. BMJ, 385, e078378. https://doi.org/10.1136/bmj-2023-078378
[12] Bland, J. M., & Altman, D. G. (1986). Statistical Methods for Assessing Agreement Between Two Methods of Clinical Measurement. The Lancet, 327(8476), 307–310. https://doi.org/10.1016/S0140-6736(86)90837-8
[13] Impellizzeri, F. M., Tenan, M. S., Kempton, T., Novak, A., & Coutts, A. J. (2020). Acute:Chronic Workload Ratio: Conceptual Issues and Fundamental Pitfalls. International Journal of Sports Physiology and Performance, 15(6), 907–913. https://doi.org/10.1123/ijspp.2019-0864
More From The Journal

Training
The Science of Strongman Training - Episode X: Competition Programming
How to build a complete Strongman competition preparation block: calendar, events, volume, intensity, specificity, simulations, autoregulation, tapering and fatigue management.
Training
The Science of Strongman Training - Episode IX: Peaking
Peaking in Strongman: how to turn months of training into maximal competition performance by reducing fatigue, preserving adaptations and managing specificity.