
Training Science
Series: STRONGMAN DATA LAB: HOW WE MEASURE AND ANALYSE PERFORMANCE - Episode 5: Analysing Split Times in Farmer’s Walk and Yoke
October 15, 2026
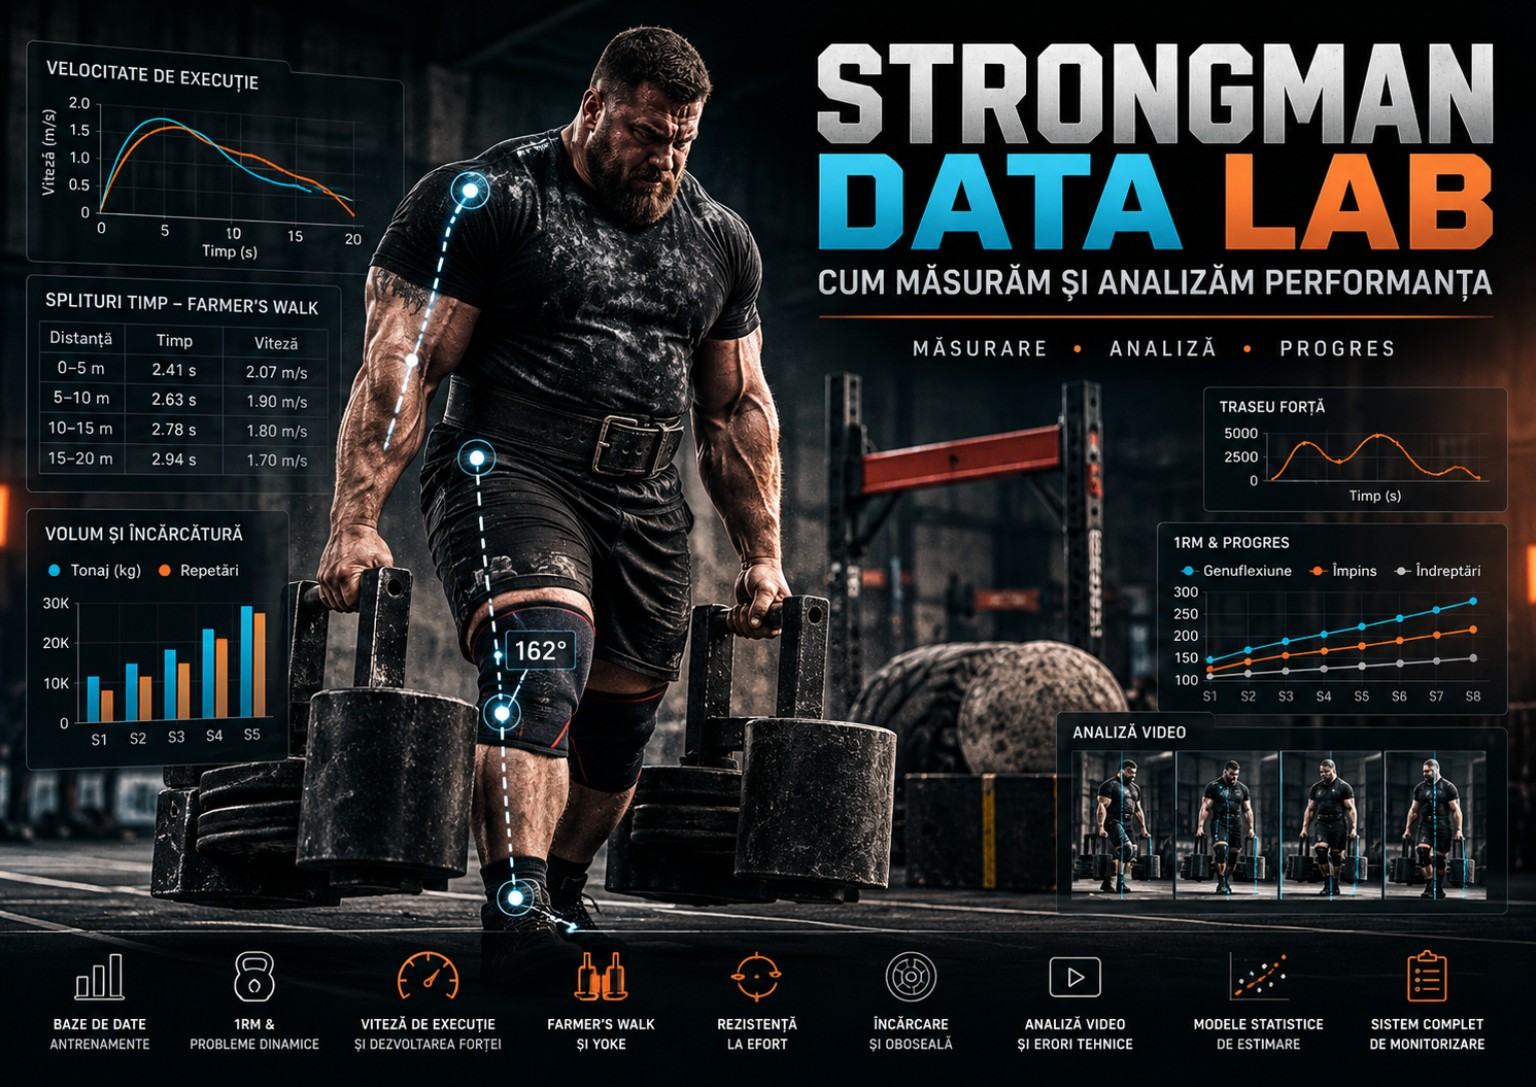
When a strongman completes a Farmer’s Walk in eighteen seconds, the stopwatch appears to tell the whole story. But how were those seconds produced? Were two seconds lost during pickup? Did the athlete accelerate well before slowing in the final metres? Was grip close to failing at the finish, despite no drop? If another competitor completes Yoke Walk in eighteen seconds, are we even measuring the same capacity? No. Finishing time records the outcome; segment analysis begins to describe how that outcome was achieved.
The first four STRONGMAN DATA LAB episodes defined measurable performance, designed a training database, explored relationships between one-repetition maxima and moving events, and examined execution velocity. Episode Five brings these ideas onto a competition course. We want to know not merely who finishes first, but where time is won or lost, which variables can be measured reliably and how the observations can guide sensible training decisions.
Relevant biomechanical studies exist, although the research base is relatively small. Keogh and colleagues studied Farmer’s Walk in five resistance-trained men performing three twenty-metre trials with 90.5 kg in each hand, observing changes in walking speed, stride length and stride rate across course phases [1]. Hindle and colleagues later examined twenty-metre Yoke Walk performance in nineteen strongman athletes using five-metre intervals [2]. These studies justify attention to event phases without creating a universal prescription for every competitor.
We will rigorously distinguish published findings from constructed educational examples. Athletes A and B, illustrative split times, training strategies and hypothetical datasets are not real competition observations. Research findings are identified with their sample and protocol, while training applications remain hypotheses that should be tested in an athlete’s own circumstances.
The two events share the requirement to transport a load along a measured course, but their physical demands are different. Farmer’s Walk suspends implements from the hands and stresses grip, shoulder position and control of handle movement. Yoke Walk places the load across the upper back and requires a tall frame to be stabilised while walking. Identical mean travel speed does not imply identical technique, strength reserve or limitation.
Our aim is a reproducible analysis: distance markers, timing rules, event phases, speed and acceleration equations, video procedures, measurement quality, numerical examples and interpretation. We will also distinguish linear and turning courses, total from per-hand loading, and uninterrupted runs from attempts resumed after a drop. Competition rules are an essential part of the quantity being measured.
1. Finishing time is not the whole performance
If two athletes finish a twenty-metre Farmer’s Walk in exactly 17.5 seconds, competition ranking may treat them equally. Biomechanical analysis should not automatically conclude that their performances are identical. One athlete might take longer to pick up the implements before moving rapidly; another might pick them up immediately and lose pace. These patterns suggest different training questions but cannot be separated using one finishing time.
An elementary decomposition is t_total = t_pickup + t_travel + t_stops, provided the phases are mutually exclusive. In competition, the timer may start at a signal and include reaction time. A timer triggered by first movement measures a different procedure. Every phase needs a clear starting and ending event, or the calculation might double-count the time in which the implements lift and the first step begins.
Consider two hypothetical eighteen-second performances. Athlete A spends 2.8 seconds in pickup and 15.2 seconds in travel, without subsequent stops. Athlete B spends 1.5 seconds in pickup and 16.5 seconds travelling. The athletes tie on the official result, but A could investigate pickup mechanics while B may benefit from transport-speed analysis. These are candidate explanations and training hypotheses rather than automatic diagnoses.
Finishing time remains the competition outcome whenever regulations define it that way. Segment times explain rather than replace it. A one-second gain at the start can be cancelled by a one-second loss near the finish. A split chart may therefore reveal local improvement without improvement in the official result, and both levels of observation should be retained.
2. What exactly is measured in Farmer’s Walk and Yoke Walk?
On a straight course we can record overall time, time to full implement clearance, time until the first step, splits at five, ten and fifteen metres, number of drops and their duration. Additional variables may include stride frequency, stride length, ground-contact duration and implement sway. The latter require more controlled video or instrumentation than a simple stopwatch.
Mean course speed differs from mean speed in each section. Covering twenty metres in sixteen seconds gives a global mean of 1.25 m/s. If four five-metre sections take 5.0, 3.5, 3.5 and 4.0 seconds, their respective speeds are 1.00, approximately 1.43, approximately 1.43 and 1.25 m/s. The last section suggests a pace reduction, but does not reveal its cause.
For Farmer’s Walk, record load per hand, whether implement mass is included, handle diameter and height, handle length and chalk or strap use where rules allow. For Yoke, record actual total load, crossbar height, frame width, contact position and surface. Changes to these conditions can alter completion time without necessarily reflecting physiological adaptation.
Every attempt should be identified as competition or training, straight or turning, one or multiple lengths, and governed by specific timing and validity rules. A straight twenty-metre course is not equivalent to two ten-metre lengths involving a turn, despite identical nominal distance. Raw data should preserve the course configuration rather than merely a label reading «20 m».
3. Anatomy of a run: pickup, acceleration, maintenance and finish
Pickup starts at the predeclared reference event and ends at another clearly defined event such as full clearance, the first step or crossing a line. Each choice answers a different question. Full clearance focuses on preparing and lifting the load; the first step includes initial stabilisation. Do not change these definitions between tests simply because one video angle makes another landmark easier to identify.
Acceleration covers the transition from rest or low speed to a more established travel pace. On a short course, this can account for a substantial proportion of total time. Both Farmer’s and Yoke research demonstrate differences between the initial interval and later sections [1, 2]. That does not mean every athlete reaches peak speed at the same distance; loading and strategy influence where acceleration gives way to other demands.
The maintenance phase is not always a perfect plateau. The athlete may alternate faster steps with stabilising corrections while average speed over five metres remains unchanged. Segment timing locates broad changes but cannot resolve every individual step. Where resources permit, fixed video and course markers can support stride-level analysis. Without such observations, interpretation should remain at split level.
The final metres may reflect local fatigue, impending grip failure, inadequate frame control or a deliberate pacing decision. Slowing at the finish is not proof of one specific weakness. Add observations about sway, corrective steps, altered posture, grip behaviour and drops. A number should generate a focused question before it generates a verdict about technique.
4. What Keogh’s Farmer’s Walk study actually established
Keogh and colleagues published a preliminary kinematic investigation of Farmer’s Walk in Sports in 2014 [1]. Five resistance-trained men completed three maximal-speed twenty-metre trials with 90.5 kg in each hand. The authors examined initial, middle and final sections, emphasising travel velocity, stride rate, stride length and ground-contact characteristics. Its value lies in examining the event itself rather than using a conventional gym lift as a proxy.
Mean travel velocity was greater during the middle and later sections than during the initial zero-to-three-metre phase, with longer and more frequent strides and shorter contact times. Comparisons among faster and slower trials also identified associations with these spatiotemporal measures. This does not justify ordering every strongman to take continuously longer steps; under very heavy loads, excessive stride length may compromise stability.
The small sample restricts generalisation. Five people using the same per-hand loading on one particular course do not represent all strongman competitors, weight classes, apparatus types and surfaces. The study did not demonstrate that a stride-frequency intervention necessarily improves contest times. It described observed patterns and provided plausible questions for further research and coaching.
An important methodological lesson is that early acceleration differs from established loaded walking. Filming only the middle of a course can miss a major source of performance variance. Measuring pickup alone misses changes in pace at the end. A useful split protocol should cover the whole task and preserve comparable phase definitions across repeated trials.
5. Yoke Walk in the laboratory: nineteen athletes and meaningful observations
In 2021, Hindle, Lorimer, Winwood, Brimm and Keogh examined nineteen male and female strongman athletes performing three twenty-metre Yoke Walk trials at 85% of their previously established event-specific twenty-metre maximum [2]. The researchers assessed mean velocity, stride length and rate, stance duration and hip and knee kinematics across five-metre intervals. The work matters because the loads were relevant to practical strongman training and the course was observed in stages rather than as one finishing time.
During the first zero-to-five-metre interval, athletes generally displayed lower travel velocity, shorter strides, lower stride rate and longer stance duration than in later intervals. Joint kinematics also differed between initial acceleration and established travel. These findings support treating the opening metres as a specific acceleration and stabilisation phase rather than merely a shorter copy of mid-course walking.
The study used a percentage of maximum performance in the Yoke event itself, not a percentage of Squat 1RM. This improves task specificity. Nevertheless, the evidence does not establish one optimal stride frequency for everyone, nor does it prove that the ideal length-frequency relationship remains unchanged at substantially heavier loads. Its findings are descriptive and should be interpreted within the sample and loading conditions.
For a coach, the practical question becomes whether time is lost because of slow pickup, poor early acceleration or repeated corrections after reaching travel speed. Five-metre splits and fixed video can help distinguish these possibilities. A club does not need to reproduce the whole research laboratory to follow its logic: define phases, repeat measurements and avoid drawing conclusions from a single attempt.
6. Stride length and stride frequency: two contributors to travel speed
Travel velocity is related to stride length and frequency. In a simplified model of steady walking, speed equals complete-stride length multiplied by complete-stride frequency. However, terminology matters: a «step» between alternate foot contacts is not the same as a full «stride» cycle returning to the same foot. Substituting steps for strides without altering the frequency definition can double or halve the calculated result.
During Farmer’s Walk, higher stepping frequency may support acceleration without placing the foot excessively far ahead of the body. Greater stride length can contribute to speed in some phases, but should not be forced when loading threatens control. Under Yoke, relatively short steps may help limit vertical frame movement and oscillation, although the appropriate strategy depends on body geometry and load [2, 3].
Imagine a complete stride length of 1.20 m and a frequency of 1.50 complete cycles per second. Estimated speed is 1.80 m/s. Increasing frequency to 1.60 cycles per second at unchanged stride length yields 1.92 m/s. The arithmetic demonstrates the relationship, not the athlete’s actual ability to sustain that frequency under a heavy implement. Control of the apparatus remains essential.
Video can support counting foot contacts over a section and deriving an average frequency, provided the analyst states whether they are counting steps or full cycles. If every contact is incorrectly labelled a stride, the column becomes misleading. The database should specify contacts per second or complete cycles per second and should not silently change definitions between sessions.
7. Ground-contact duration and impulse production
Walking under heavy load requires repeated interactions between the feet and the ground. Mechanical impulse in a direction is the integral of force over time, J = ∫Fdt; with a constant representative force, J ≈ F_mean × Δt. Contact duration is not impulse, because force magnitude and direction remain unknown. A short contact may involve high force, while a longer one may be part of an effective stabilisation strategy.
Farmer’s Walk studies have reported shorter contacts in faster runs under particular conditions, alongside higher step rate and stride length [1, 4]. This does not prove that deliberately shortening every contact improves every event. Very heavy loads may call for longer support to maintain balance, and contact duration alone does not reveal horizontal ground reaction force or trunk control.
With 120-fps video, the interval between initial foot contact and toe-off may be estimated if the camera angle and picture quality allow consistent event identification. A difference of only a few frames can materially affect a short contact estimate. If those moments are hard to identify repeatably, split times are a more defensible metric than a sophisticated-looking but fragile gait analysis.
A coach may observe that one Yoke athlete uses irregular contacts and frequent corrective steps, whereas another maintains a consistent rhythm. That observation is useful without a force plate. Detailed mechanical analysis, however, requires instrumentation capable of measuring forces and trajectories. We should not invent numerical forces from visible movement alone.
8. Initial acceleration: the component hidden inside total time
Mean acceleration is change in velocity divided by time, a = Δv/Δt. Starting from rest makes the equation intuitive, but the true acceleration history cannot be recovered from distance and a single section time without assumptions about movement. Mean velocity over five metres is not instantaneous velocity at the five-metre line. The distinction becomes critical when comparing starts.
Imagine an athlete completing the first five metres in four seconds, including pickup, and the next five metres in 2.8 seconds. Section means are 1.25 and approximately 1.79 m/s. We can describe a slower opening section, but cannot directly calculate the athlete’s actual acceleration in m/s² from the difference between these two averages. Boundary velocities or an explicitly justified movement model would be needed.
To study starts, we may separately record pickup, the first two steps and crossing the five-metre marker. If pickup becomes faster while the zero-to-five-metre split remains unchanged, the subsequent acceleration phase may have slowed. If pickup is stable while the opening split improves, initial walking may have become more efficient. Overall course time cannot distinguish these explanations.
Aggressive acceleration must be balanced against apparatus stability. In Farmer’s, jerking the handles can amplify swinging and challenge grip. In Yoke, excessively long first steps may initiate frame oscillations. More acceleration is not always the solution; controlled acceleration is the relevant task. An unusually slow first split begins the investigation rather than ending it.
9. Implement pickup: when the opening seconds decide the event
Farmer’s pickup resembles a form of deadlifting, but the implements are held alongside the body and grip and trunk position change force distribution. Winwood and colleagues compared Farmer’s lifting with conventional Deadlift and loaded walking with unloaded walking in six experienced strongmen, reporting meaningful biomechanical differences [4]. A high Deadlift record is therefore not a complete explanation for efficient Farmer’s pickup.
Yoke pickup involves positioning beneath the crossbar, generating tension and extending the body until the frame clears the ground. Crossbar height alters range of motion and leverage. A low setup may cost time and stability, whereas a high position may produce insecure contact. There is no universal setting independent of athlete anthropometry and frame geometry.
Fixed side and front video can capture opening movement without putting equipment in the athlete’s path. We might timestamp the signal, full clearance and the first stable step. If differences between attempts concentrate here, assess initial position, pre-tension, timing and apparatus control. It would be premature to conclude simply that the competitor «lacks strength», because the same weight can be lifted with different technical efficiency.
Imagine hypothetical Farmer’s runs of 19.2 and 18.1 seconds at unchanged loading. Pickup falls from 2.9 to 1.9 seconds while travel time remains almost stable. Nearly the entire improvement occurred at the start. The coach should not describe it as increased walking speed. Segment analysis provides a more specific account and can prevent inappropriate programme changes.
10. Cumulative times versus split times: columns that must not be confused
Intermediate timing may report cumulative values at five, ten, fifteen and twenty metres. A hypothetical sequence could be 4.8, 8.1, 11.3 and 14.7 seconds. Putting those numbers directly into a chart labelled «time per five metres» would be wrong: they increase because each includes the previous sections. Actual section times are 4.8, 3.3, 3.2 and 3.4 seconds. This elementary distinction is crucial to interpreting an event.
The relevant equation is t_split_i = T_cumulative_i − T_cumulative_(i−1), with the starting cumulative time defined as zero. Section mean speed is v_i = section distance / t_split_i. For a precisely measured five-metre section, divide five by its duration in seconds to obtain metres per second. Do not calculate overall speed using only the last split, and do not treat section mean speed as peak instantaneous speed.
A useful table retains both types. Cumulative times permit reconstruction and checking against the official finish. Split times describe performance distribution. If the cumulative reading at fifteen metres is missing, the ten-to-fifteen-metre section cannot be reconstructed reliably; we may retain a combined ten-to-twenty-metre interval. Straight-line interpolation would hide the very pacing changes we want to detect.
Comparisons must use equivalent intervals. Zero-to-five metres from one run should not be compared with zero-to-three metres from another as though they measured identical tasks. During acceleration, converting both to metres per second does not solve the phase mismatch. The first three metres might contain nearly all pickup and initial contact, whereas the next two include established loaded walking. Accurate definitions are more important than elegant arithmetic.
11. A complete twenty-metre Farmer’s Walk example
Consider a hypothetical athlete carrying 120 kg per hand over twenty metres without stopping. Cumulative times are 5.20 seconds at five metres, 8.60 at ten, 11.90 at fifteen and 15.40 at the finish. Split times are therefore 5.20, 3.40, 3.30 and 3.50 seconds. Corresponding mean speeds are about 0.96, 1.47, 1.52 and 1.43 m/s. The pattern shows a slower opening section, acceleration, then slight late slowing.
Suppose 2.10 seconds of the opening split occur before the implements are completely clear of the floor. The other 3.10 seconds represent the remainder up to the five-metre crossing event, under this timing definition. Dividing five metres by 3.10 seconds gives approximately 1.61 m/s, but only if the five-metre displacement starts after pickup and the landmark definition supports that interpretation. This shows how an apparently simple «opening split speed» can represent different quantities.
Six weeks later, the athlete completes the same course in 14.60 seconds with cumulative times of 4.80, 8.00, 11.20 and 14.60 seconds. Splits are 4.80, 3.20, 3.20 and 3.40 seconds. The overall gain is 0.80 seconds: 0.40 in the opening section, 0.20 in the second, 0.10 in the third and 0.10 in the last. Half the improvement occurred in the first five metres. This locates performance change rather than identifying a specific physiological adaptation.
A pickup measure can determine whether the opening gain arose before or after full clearance. If pickup remained at 2.10 seconds, subsequent movement must account for the difference under a stable definition. If pickup fell to 1.70 seconds, the entire 0.40-second gain can be accounted for numerically by the pickup phase. Even then, the cause could be technique, preparation, increased strength or familiarity. Split analysis localises change without uniquely explaining its mechanism.
12. Twenty-metre Yoke analysis: the same arithmetic, different meaning
Imagine Yoke at a total load of 320 kg with consecutive five-metre splits of 6.0, 4.1, 4.0 and 4.3 seconds. Overall time is 18.4 seconds. Initial time includes setup, pickup and early travel; the next intervals are more uniform. The final section is slower, but video is required before attributing the change to fatigue, sway or deliberate pacing.
Mean section speeds are about 0.83, 1.22, 1.25 and 1.16 m/s. This sequence locates changing pace, but comparing it directly with the Farmer’s example does not establish which athlete is «faster» in a general physiological sense. Loads, mass distribution, centre-of-mass position and control requirements differ. The observations describe distinct tasks.
After a technical training block, the athlete might record 17.9 seconds with splits of 5.9, 3.9, 3.9 and 4.2. The half-second improvement is distributed across all stages. If video also shows smaller oscillations and steadier cadence, we can hypothesise that stability contributed. However, physiological adaptations and day-to-day differences cannot be excluded. Two trials are a starting point for investigation, not a causal experiment.
Comparing distinct loads requires a separate question. Equal travel speed at 300 and 340 kg does not indicate equal difficulty. Heavier loading may alter steps, posture and stability. To study progress at a fixed load, hold mass and apparatus constant; to profile the relationship between load and course time, use multiple controlled loads. The two designs should not be silently merged into one indicator.
13. Turning events: the same nominal distance, a different course
Competitions often require an out-and-back course or a turn because of venue constraints. Farmer’s Walk over two ten-metre legs includes acceleration, braking, implement control during the turn and re-acceleration. A straight twenty-metre run does not impose the same sequence. Reporting only «20 metres, 17 seconds» without the turn layout may combine fundamentally different events.
A turning course can be analysed as approach, pivot and return. If implements must be set down at a turning point, this creates a separate regulated phase. If the athlete must turn without a drop, handle swing and trunk control become especially important. Some course designs allow a broad arc; others impose a tight turn. Actual implement travel distance may differ even when nominal distance is the same.
A hypothetical athlete completes a straight twenty metres in 16.0 seconds but requires 20.1 seconds for two ten-metre legs with a turn. The 4.1-second difference should not simply be diagnosed as «lack of strength». It includes the added mechanical and coordination costs of deceleration, changing direction and restarting. Measuring approach and turn time would help, although defining each boundary precisely may require video.
Create distinct course identifiers in the database. If cone placement or turning radius changes, document it. Preparation for a specific contest is better served by reproducing the actual event rules than by treating a straight-course personal best as directly comparable with a turning-course result. Information becomes useful when it reflects the task the athlete is preparing to perform.
14. Drops, pauses and restarts: the seconds concealed by overall averages
Farmer’s Walk may include grip failure, deliberate drops or implement readjustment, depending on the rules. Under Yoke, the athlete may set down the frame to regain control or be forced to stop because the position is unstable. A slow finishing time may reflect one substantial interruption despite fast travel between stops. Global mean speed does not identify the distinction.
A paused attempt should preserve time before stopping, time spent with the implement on the floor, re-pickup duration and travel after restarting. Avoid double counting: if re-pickup is already included in pause duration, it must not be added again unless the phases are redefined to be mutually exclusive. A well-defined decomposition should reconstruct total official time within known measurement tolerance.
Imagine a twenty-metre Farmer’s effort taking 25.0 seconds, including a four-second interval after a drop before travelling again. Global mean speed is 0.80 m/s. If active elapsed time excluding that pause is 21.0 seconds, 20/21 is about 0.95 m/s. However, this number is not necessarily «pure walking speed» if the initial pickup remains included. Labels must disclose exactly what the calculation excludes and what it retains.
From a coaching standpoint, repeated grip-related drops differ from continuous slowing without a drop. The former may direct attention to handle diameter, swing, hand position and specific grip endurance. The latter might emphasise pacing, frame stability or conditioning. Data do not prescribe an intervention automatically, but prevent one vague explanation from being applied to every slow run.
15. Hand timing, photocells and what each method can and cannot do
A handheld stopwatch is inexpensive and useful, but timing depends on the operator’s reaction when starting and stopping. This matters especially over short sections of three or four seconds, where an error of a few tenths is proportionally large. Electronic systems can reduce some sources of uncertainty, but are not automatically perfect. Beam activation, gate placement and start definition all affect the reading.
Bond, Willaert and Noonan compared three systems for short sprint timing and showed how body lean and the segment activating a sensor can influence measured results [5]. A systematic review of photocells noted that double-beam systems can reduce false triggers caused by limb movement under some conditions [6]. Most of this research concerns conventional running; application to heavy carried implements requires additional attention.
In Farmer’s, a handle may cross the light beam before the trunk or obscure a sensor. In Yoke, parts of the frame can activate a gate before the athlete reaches it, and sidebars may interrupt the beam repeatedly. If the variable is defined as the body crossing a marker, the photocell may not automatically measure that criterion. Gate arrangement needs to be part of the protocol and checked against fixed video.
A practical club might use fixed video to define key events and electronic timing for repeatability where available. Both systems need not be used on every attempt. Consistency matters more than alternating hand timing, a mobile application and electronic gates without studying their agreement. Each record should state the method rather than pretending all timing approaches share identical error.
16. Start-line position and response to the signal
During competition, athletes may wait for the judge’s signal with implements on the floor or already in a prepared lifting position. Some procedures start the timer with the command, others at first detected movement. The difference may include reaction time and the onset of tension building in the apparatus. Over a fifteen-second event, fractions of a second can materially affect interpretation of small improvements.
A signal-triggered first five-metre split includes reaction, pickup and early movement. Video analysis beginning at the first visible frame movement excludes reaction time. Both answer legitimate but different questions. An athlete can improve official performance through better response to commands without increasing steady loaded-walking speed.
A reproducible protocol might label three events: official signal, first visible movement and full clearance from the ground. If video does not capture the start audio, the first event may be unavailable. Do not invent a reaction time without the signal. Record the events visible in the footage and distinguish «from movement» analysis from the official «from signal» result.
Training may alternate commanded and self-initiated starts for a clear coaching purpose, but the records should remain separate. As a competition approaches, reproducing its actual regulations is more useful than an idealised laboratory start that removes every inconvenient fraction of a second. Athletes must succeed in the real event, not merely in an analyst’s simplified test.
17. Video placement: realistic methods and limits
For a straight twenty-metre course, a fixed camera safely positioned to the side can capture split markers if resolution and field of view are adequate. Rear video may be valuable for lateral sway but creates other distance-estimation challenges. Front video can reveal frame control, yet different perspectives cannot simply be combined into assumed three-dimensional tracking without calibration.
When timing, identify the precise video frame where a predefined body or implement landmark crosses the line. A torso-centre criterion must remain consistent, although Yoke equipment may conceal it. Using the leading edge of a handle produces a different event. In many club settings, applying one landmark consistently and estimating its error matters more than the particular landmark chosen.
At sixty frames per second, frames are about 0.0167 seconds apart; at 120 frames per second, about 0.0083 seconds apart. This is not the automatic accuracy of video timing. Blur, resolution, compression and event selection can add error. Two or three frames of variation may occur without any true performance difference. Responsible analysis reports the practical limitation rather than hiding it behind decimals.
The basic setup is simple: stable tripod, visible markers, uniform lighting, fixed framing and written testing notes. A dramatic tracking shot may be excellent promotional footage and poor timing evidence. In a data lab, video must first be a verifiable source of observations. Camera angle follows the measurement question, not cinematographic style.
18. Timing reliability: when change is smaller than error
If the same athlete performs three comparable efforts in 16.7, 16.9 and 16.8 seconds, variation can arise from genuine performance fluctuation as well as measurement uncertainty. The efforts are not physiologically identical: each one produces fatigue and each recovery interval affects the next. Reliability assessment therefore needs a procedure that controls these influences as well as reasonably possible.
Atkinson and Nevill described statistical principles for evaluating error in sport measurements [7]. Standard deviation, coefficient of variation and between-rater differences can help describe the noise. We should specify whether error refers to timing the same video repeatedly, repeating the physical performance, or both. These are different processes and should not be interpreted as equivalent.
Imagine two analysts timing the same recording five times, with disagreements reaching 0.20 seconds. If an athlete is subsequently declared «faster» by 0.08 seconds, the claim exceeds the evidence. The difference can still be logged, but the data do not reliably establish adaptation. Repeating the assessment, choosing a clearer landmark or using suitable electronic timing may help.
Small improvements can be genuine even when the available measurement cannot demonstrate them. Acknowledging methodological limits does not mean the athlete has stopped improving. It means the question requires more observations or a better measurement procedure. Sport science should reduce unwarranted certainty rather than generate decorative precision.
19. Organising three comparable test attempts
Practical testing may use a small number of attempts at unchanged load and distance, separated by sufficient recovery to limit fatigue. The ideal number is not universal. Very heavy Yoke can require more recovery than moderate Farmer’s. A speed test should not automatically become a workout to exhaustion, because later attempts may then reflect accumulating acute fatigue.
Record trial order and events that differentiate attempts: slipping, excessive sway, altered apparatus, camera obstruction or external interference. If an athlete intentionally changes pickup technique between attempts, the conditions should be labelled separately. Do not average across distinct tests without explaining the purpose. A mean is informative only when the underlying attempts represent a comparable question.
For longitudinal monitoring, we may select the fastest valid effort or the mean of three, but the choice must precede data collection. The fastest effort reflects peak observed performance but may be favoured by chance variability. The mean may be more stable, yet can be influenced by technical failures or fatigue. Retaining all attempts and reporting both summaries when relevant is often transparent.
Across weeks, standardise warm-up, implement, markers and surface when possible. That does not mean physiology can be controlled completely. Poor sleep, recent training and other contextual factors can influence performance. The data describe a performance in a particular setting rather than an unchanging personal capacity.
20. Course construction: small layout errors can become competition seconds
A competition course is defined by distance, width, surface and start and finish markers. Training courses are sometimes approximate: «about twenty metres», markers moved after equipment rearrangement or a turning point placed differently from last week. Increasing actual distance from twenty to twenty and a half metres can alter both time and computed speed. Physical measurement of the course is therefore the first condition for comparison.
Use a suitable measuring tape or accurate measuring tool rather than estimating distance from steps. When marking five-metre sections, verify overall course length as well as each marker position. For turning events, specify whether the nominal distance is measured to a cone centre, line or other reference. If the course permits different turning trajectories, athletes may not travel identical actual distances despite nominally identical layouts.
A soft or uneven surface can affect ground contact, balance and movement cost. Gravel, rubber flooring, concrete and asphalt are not automatically equivalent. Even small slopes or changes in traction can affect acceleration. Document these conditions, particularly when a facility change coincides with a substantial performance difference. A personal record is more interpretable when the test conditions are known.
Yoke course width can restrict lateral corrections and alter how the athlete approaches the finish. Long Farmer’s implements create different clearance problems in narrow corridors or at turns. Record available width and relevant obstacles. A performance laboratory begins with an accurately defined course, not with an impressive laptop dashboard.
21. Actual loading: declared weight versus carried mass
In Farmer’s Walk, «140 kg» might mean 140 kg per hand, 140 kg combined or plates added beyond the mass of the handles. Without this convention, comparisons may be meaningless. One athlete logging «Farmer’s 130» and another logging «Farmer’s 260» could describe exactly the same task with 130 kg in each hand. Store left-hand mass, right-hand mass and combined mass explicitly.
If an implement weighs twenty kilograms and an athlete adds one hundred kilograms of plates, total mass is 120 kilograms for that handle. Recording only plates systematically understates the load. Competition organisers may announce nominal weights using different conventions. Preserve the reported official figure and the verified physical interpretation when available. Do not assume all implement frames share identical mass.
Yoke total loading includes the frame and attached plates or other relevant components. Two nominally equal 300-kg yokes may distribute mass differently and have different centres of gravity. Such differences can alter sway and stabilisation demands. Equality of total mass therefore does not guarantee biomechanical equivalence. Retaining an apparatus identifier is important.
Store consistent units, preferably kilograms, for longitudinal analysis. If an overseas competition provides loads in pounds, convert them accurately and retain the original unit. Mistaken conversion or rounding can produce false trends. This is elementary work, but it is foundational to a trustworthy sports dataset.
22. Grip during Farmer’s Walk: when velocity does not explain the full race
During Farmer’s, the hands and forearms must maintain contact with moving implements that swing with each step. As grip approaches its limit, an athlete may slow down to reduce oscillation and avoid a drop. From outside, this can resemble leg fatigue even when the dominant difficulty is maintaining the handles. Timing alone cannot identify the limiting system; video and athlete feedback provide necessary context.
Handle thickness, gripping surface, texture and chalk can change the demand. A handle gradually slipping in the palm may cause compensatory elbow or shoulder adjustments, which can influence gait. Record visible regrips and whether they occur before, after or independently of a slowing split. The order does not prove causation, but helps identify an investigation worth pursuing.
Imagine a hypothetical athlete completing middle sections in 3.4 and 3.5 seconds before taking 5.0 seconds for the final five metres without dropping the handles. Video shows the right handle slipping and a deliberate shortening of steps. A plausible interpretation is grip-related slowing, but the exact contribution cannot be quantified from these observations. A separate grip-endurance test or controlled change of handle may help test the explanation.
Training may focus on implement balance, hand placement, holding capacity or pacing. Automatically prescribing more forearm work is not always the correct response; if uncontrolled swing creates the difficulty, improved gait mechanics may be more relevant. Good analysis connects the observed limitation to a testable intervention and evaluates subsequent performance on the actual event.
23. Yoke sway: how small corrections can produce substantial losses
Yoke is a frame with inertia and the capacity to oscillate. It does not move exactly with the athlete’s centre of mass. A lateral step, irregular rhythm or sudden directional change can produce sway, and the athlete may spend additional steps correcting the frame. Mean speed can fall even without any decrease in maximal force capacity. Slow splits should therefore be interpreted alongside stability observations.
Rear video may reveal lateral deviations; a side view may reveal forward-back and vertical movement. Numerical quantification of oscillation requires calibration and a defined tracked landmark. In ordinary training, descriptive categories can be useful: no visible sway, moderate controlled sway, repeated corrections or loss of control. Categories should be operationally defined and applied consistently.
Suppose athlete A completes a run in nineteen seconds with even steps, whereas athlete B takes twenty seconds after faster initial acceleration followed by two major corrections. This does not prove that A is maximally stronger. It shows B losing time during phases associated with observable instability. If a more controlled start reduces those corrections at unchanged load, the sway hypothesis gains practical support.
The 2021 Yoke study documented gait characteristics under heavy loading and changes across intervals [2]. It does not imply that sway can be completely removed or that one short-step pattern suits everyone. Walking strategy must serve the stability demands of the specific task. A fast athlete who repeatedly approaches loss of control may benefit from a more measured distribution of acceleration.
24. Cadence, breathing and maintaining position under load
Loaded walking cadence can be affected by breathing strategy and trunk stabilisation. In Yoke, abdominal pressure and postural control contribute to supporting the frame. In Farmer’s, shoulder girdle and trunk muscles help limit unwanted oscillation. Internal pressures and muscular forces cannot be measured directly from ordinary video, however. Avoid excessive physiological conclusions based on visible movement alone.
An athlete may become less regular in stride rhythm while struggling to breathe under effort. Video may reveal cadence fluctuation, but cannot establish its cause. A training diary recording breathlessness, discomfort or the need to pause can complement timing observations. Similarly, speed data are better interpreted alongside perceived exertion and technical quality.
Training may include moderately loaded repetitions to practise coordination, trunk control and breathing compatible with safe execution. Prolonged breath-holding or ignoring symptoms should not be encouraged merely to protect a finishing time. Dizziness, chest pain or loss of control require stopping the attempt and obtaining appropriate assessment. Competitive performance does not override safety.
Analytically, we want to know whether movement remains stable during longer loaded sections and whether pace losses coincide with particular postures or adjustments. Sometimes the intervention involves technique; sometimes it involves modifying training load. The data have to be interpreted in context.
25. The load–time relationship: constructing an individual profile
As loading increases, course duration often rises, but the relationship need not be linear. One athlete may maintain similar speed across moderate loads before time increases sharply as grip or stability approaches its limit. Another may show slower pickup under heavy load while travelling well once the implement clears the ground. A load–time profile describes an athlete and apparatus in specific conditions rather than a universal constant.
An exploratory Farmer’s profile could use carefully selected loads of 90, 110 and 130 kg per hand. Hypothetical twenty-metre times of 13.8, 15.7 and 19.9 seconds reveal a disproportionate increase at the highest load. These points alone cannot establish that grip is the limiting factor; video, athlete feedback and repeated observations are needed. Nor can we extrapolate linearly to 150 kg without testing the model.
For Yoke, another hypothetical pattern could be 15.0 seconds at 260 kg, 16.4 at 300 kg and 20.2 at 340 kg. The larger deterioration in the upper range merits investigation but does not establish whether the mechanism is strength, technique or stability. Combining total and split times shows whether performance deteriorates chiefly at pickup or throughout the course.
Testing numerous very heavy loads in one day can create disproportionate fatigue and risk. In practice, existing programmed sessions may provide the relevant observations if conditions are sufficiently comparable. A data profile should not require an artificial contest merely to populate a spreadsheet. The purpose is to identify where performance begins to change while protecting longer-term training.
26. Body mass and comparing athletes
A 300-kg Yoke is not the same relative load for athletes with very different body mass and event-specific strength. But simply dividing frame mass by athlete body mass does not create a complete difficulty index. Frame geometry, height, experience, technique and mass distribution all influence performance. A body-mass ratio can therefore create a misleading impression of biomechanical equality between competitors.
When analysing a weight class, it may be useful to report transported mass both absolutely and relative to athlete mass. These values answer different questions. Absolute mass describes external load; relative load offers context without normalising every relevant difference. For Farmer’s, specify whether the ratio uses per-hand or combined loading. Ambiguous ratios are particularly easy to misinterpret.
Suppose a 100-kg athlete and a 150-kg athlete both carry 120 kg per hand. The external-load-to-body-mass ratios differ, but this does not establish which athlete produces greater force or controls the implements more efficiently. Course time remains the direct outcome, and any explanation must consider additional evidence. No simple ratio can replace event technique and competitive context.
For longitudinal monitoring of one person, meaningful body-mass changes deserve documentation. They can alter loading ratios and movement patterns, including stride length or cadence. Yet causation cannot be assumed. If course time changes while body mass changes, consider programming, recovery, surface and technique as alternative or contributing factors.
27. Comparing Farmer’s and Yoke: kinematic similarities, mechanical limits
Both events require loaded walking, repeated force impulses and stabilisation. Yet the systematic review of strongman biomechanics shows differences in spatiotemporal characteristics and mechanical requirements [3]. Farmer’s implements can move independently in each hand, whereas Yoke is primarily a shared rigid structure carried across the back. This changes the transmission of oscillation and the athlete’s control strategy.
Do not use maximum Farmer’s travel speed to directly predict Yoke performance under a different load. Such a conversion requires relevant validation data. Instead, assess the ability to accelerate under load and the ability to maintain stable movement separately. If an athlete starts quickly in Farmer’s but slowly under Yoke, pickup, balance and familiarity are plausible questions, not automatic evidence of poor leg speed.
One useful descriptive measure is the proportion of total time spent in the first five metres. If Farmer’s takes sixteen seconds, with five seconds in the opening section, the proportion is 31.25%. If Yoke takes twenty seconds and seven seconds are spent in the opening section, the proportion is 35%. These figures describe temporal distribution, not a pure measure of acceleration unless start rules, loading and phases are comparable. A high percentage may include a prolonged pickup.
A stronger method monitors progress within each event and examines relationships across repeated training blocks. Both events becoming faster may reflect common adaptation, separate technical gains or a combination. Improvement in only one event reveals specificity but does not by itself identify the limiting factor. Their similarities do not erase event-specific demands.
28. Composite indicators: when scores help and when they obscure
A coach may want one score summarising pickup, average speed and late slowing. These variables have different units and meanings. Simply adding seconds to metres per second is physically meaningless. Statistical normalisation can create a composite index, but its weights must be justified and disclosed. An attractive two-decimal score can conceal subjective modelling choices.
For one athlete, three separate figures may be more useful: pickup duration, fastest five-metre split and difference between final and fastest sections. These require no opaque algorithm and point towards distinct training questions. If the last section takes 1.2 seconds longer than the middle, that is a concrete observation worth investigating. There is no obligation to compress everything into a score from zero to one hundred.
If a composite indicator is needed for a group, document reference distributions, transformations, weights and treatment of missing values. Identical scores can conceal completely different profiles. An athlete with weak pickup and a strong finish might equal one who starts rapidly and nearly stops at the end. For coaching decisions, such numerical equality could be misleading.
Finally, assess whether the score improves decisions. Does it predict event outcomes more accurately than finishing time and split times viewed separately? Does it change what the coach does? Does it remain useful with another frame or another athlete? If not, the index can be discarded. Complexity is justified only when it reduces relevant uncertainty.
29. Mean speed is not maximum speed: a mathematical warning
A five-metre split of 2.5 seconds gives a mean speed of 2.0 m/s. It does not show that the athlete reached precisely 2.0 m/s at the middle of the section or that 2.0 m/s was peak speed. The athlete could enter at one velocity, accelerate and exit at another, while producing the same average. Estimating instantaneous movement requires denser temporal sampling and a suitable validated method.
This distinction matters in training interpretation. If mean section speeds are 1.2, 1.6, 1.7 and 1.6 m/s, we have identified the section with the highest mean, not the exact moment of peak speed. When writing «maximum speed at ten to fifteen metres», a more accurate phrase is «highest measured mean section speed». Precise wording prevents the claim from exceeding data resolution.
Radar or more elaborate video systems might estimate within-section velocity, but the method requires validation for the apparatus and layout. A smooth curve on a phone screen is not sufficient evidence. We must know which positions, frames and filters produced it. In Yoke, a sensor attached to the frame may temporarily move differently from the athlete’s centre of mass because of oscillation.
Public reporting should avoid claims such as «this proves the athlete is the most explosive» merely because the fastest split belongs to them. It is an outcome under specified loading and conditions, potentially influenced by force, technique, acceleration, orientation and measurement variation. Interpretation must remain proportionate to observation.
30. Diagnosing the first half: what a slow opening ten metres means
When the first ten metres are slower than previous comparable attempts, analysis begins by separating pickup from subsequent travel. Longer pickup may involve positioning, insufficient pre-tension, unfavourable leverage or simply the athlete’s condition that day. Slow acceleration after clearance may reflect early stride frequency, control of sway or difficulty generating horizontal impulse. These are distinct possibilities requiring different observations.
In a hypothetical example, athlete A needs ten seconds for the first ten metres, including three seconds of pickup. Athlete B reaches ten metres in nine seconds with a 1.8-second pickup. A’s pickup is 1.2 seconds slower even though the total first-half difference is only one second. A may actually travel the remainder of the distance a little faster. Without segmentation, a coach might wrongly diagnose A as the slower walker.
Training can test changes in Farmer’s starting position or Yoke crossbar height while keeping loading and course constant. Compare several valid attempts rather than one unusually successful lift. If faster pickup produces more subsequent instability, the intervention may be inappropriate despite the local time gain. The goal is the best safe completion time, not the shortest isolated pickup at all costs.
The interpretation differs when difficulty appears only at high loads rather than at every load. A small load-by-section table can help identify the range where performance deteriorates. This is an exploratory practical model, not a medical test or exact neurological assessment. It directs the next training question.
31. Diagnosing the final half: pace loss or conservative strategy
When the ten-to-twenty-metre portion slows disproportionately, performance has deteriorated in the later phase. But interpretation depends on what happened earlier. An aggressive opening may lead to subsequent losses, while a controlled start may preserve rhythm. In Farmer’s, approaching grip failure can shorten steps; in Yoke, greater sway may force corrective movements.
Imagine splits of 4.5, 3.0, 3.5 and 4.8 seconds, totalling 15.8 seconds. A second attempt yields 4.7, 3.2, 3.3 and 4.1 seconds, totalling 15.3. The second start is slower, but the overall result is better. The example supports investigating load distribution and pacing instead of automatically rewarding the fastest possible first split.
Stopping because of impending failure differs from controlled slowing. If an athlete starts losing the implement or moving unsafely, «pushing through the final metres» is not an appropriate response to a chart. Analysis should retain unsuccessful attempts and safety criteria. A fast but poorly controlled trial does not necessarily provide a suitable model for repeated training.
Two pacing strategies can be compared at unchanged load with adequate rest. If the more measured opening repeatedly improves finishing time and reduces corrections, it gains practical support. If the difference disappears over several sessions, an initial impression should not harden into a universal rule.
32. Event-specific loaded endurance: what slowing actually describes
Endurance in Farmer’s and Yoke is not equivalent to cardiovascular performance during unladen running or the ability to hold a bar statically. It involves repeating steps under load while maintaining grip, posture, contact and stability. Late-course slowing may arise through multiple pathways and must be interpreted as part of the whole event.
A descriptive slowing index could be defined as 100 × (final five-metre split / fastest middle split − 1). If the middle section takes 3.2 seconds and the final one 4.0 seconds, the index is 25%. This means the final section took 25% longer than the chosen middle reference. It does not equal «25% fatigue» or a measured muscle deficit. The value allows comparison of pacing distribution under similar conditions.
A forty-metre course provides more sections for assessing pace maintenance, but also creates more opportunities for the limiting factor to change. An athlete may accelerate well before becoming restricted by grip or instability. Specific endurance should therefore be assessed alongside drops and technical observations. Two athletes with the same slowing index may have entirely different limitations.
Training might include standardised submaximal carries while monitoring whether speed remains relatively stable across the course. Not every session needs to become a long maximal race. Volume and intensity follow the training phase, recovery status and competition rules. Monitoring describes the response observed, not a universal ideal dose.
33. Studying fatigue without confusing training and testing
To investigate within-session fatigue, we might compare two attempts at unchanged load with a predetermined and recorded recovery period. Their difference nevertheless reflects possible learning, preparation, motivation and measurement error as well as fatigue. Repeated observations across sessions provide stronger evidence than one comparison. One pair of efforts cannot isolate every mechanism.
Imagine Yoke performances of 19.0 and 20.5 seconds separated by a short rest. The difference is 1.5 seconds, approximately 7.9% of the first time. If every section slows, a general fatigue explanation becomes plausible. If only pickup deteriorates, the initial lifting phase deserves more specific examination. Neither pattern independently establishes a precise physiological cause.
Record actual rest duration, warm-up, temperature, surface condition and perceived exertion. A run performed after ten minutes of recovery cannot be compared casually with one performed after two minutes, then interpreted as evidence of a six-week adaptation. Context belongs to the observation. Without it, many measurements become unsuitable for longitudinal analysis.
Deliberately testing repeated heavy attempts to failure can introduce unnecessary risk and compromise training. Monitoring should be integrated into normal preparation, with justified rest and loading. The best measurement often answers a question while preserving the athlete’s capacity for the next planned session.
34. Selecting accessory exercises from a split-time profile
When pickup dominates time loss, accessory training might address starting position, pre-tension and relevant force capacity without assuming automatic transfer from a particular gym lift. Farmer’s-specific pickups and controlled holds may be candidates; Yoke setup and initial steps under suitable loads may also be tested. The full event remains the ultimate verification task.
If walking rhythm is the main observed limitation, analyse stride frequency and length under actual loading rather than imposing «take bigger steps». Moderately loaded drills may help consolidate coordination. Yet a technique effective at half the competition load may not behave identically at ninety percent. Exercise loading must account for transfer, fatigue and control.
If final sections deteriorate because of grip, investigate specific holds, progressive carries and implement-sway control. If Yoke slows chiefly through frame instability, forearm work is not a direct solution. The aim is not to generate an enormous exercise menu, but to eliminate unsuitable hypotheses and select testable interventions.
Evaluate interventions over a meaningful training block while preserving comparison conditions. Stronger accessory lifts without improvement in the full event do not establish transfer. That result is useful: it may suggest greater specificity, different programming or reconsideration of the original diagnosis.
35. The training microcycle: using splits without timing everything obsessively
A practical system does not demand maximum information from every session. One athlete may use a standardised Farmer’s reference run on one day and a Yoke observation on another, without adding tests that undermine the main training. During high-volume periods, ordinary programmed attempts may provide enough data to avoid chasing records every week. Testing should support preparation rather than compete with it.
A hypothetical microcycle could include two moderately loaded Farmer’s carries over the same distance during a weekend session, followed by scheduled specific work. Yoke might be evaluated through a few controlled technical intervals at manageable loads. Both events need not be timed maximally in one session. With demanding weekday training, test volume should be adjusted to actual recovery.
During technical development, we may look for better time distribution and fewer corrections rather than only faster final results. During intensification, we may track whether valid runs are maintained as loading increases. Near competition, the priority becomes reproducing the actual distance, start rule and course features as closely as possible. The meaning of a measure changes with the training objective.
A correctly completed file with five relevant fields can be more valuable than thirty metrics that nobody can maintain. Collect information capable of affecting decisions: pickup time, major splits, stops and meaningful technical deviations. Keep short contextual notes. Consistent observation across months generally provides more value than one spectacularly analysed session.
36. Longitudinal example: eight weeks of Farmer’s Walk
Imagine eight weeks of straight twenty-metre Farmer’s Walk at 110 kg per hand, with final times of 18.6, 18.4, 18.7, 18.1, 17.9, 17.8, 17.6 and 17.4 seconds. The hypothetical series suggests a downward trend with some early fluctuation. Yet eight finishing times alone cannot establish the adaptation mechanism. Splits and an estimate of test variation add crucial context.
Suppose mean opening split improves from 5.8 to 5.0 seconds while later sections improve less. Video shows more secure pickup and quicker coordination of initial steps. We can identify the initial section as a major contributor to observed progress. We cannot attribute every gain to one accessory exercise, particularly if body mass, training volume and familiarity also changed during the period.
Retain every valid run, including the slower third week, rather than selecting only flattering observations. If the fastest attempt from each week is reported, specify this criterion and the number of attempts available. A best time chosen from five opportunities differs methodologically from a single-trial result. Fair comparisons need to document the opportunities from which each reported value arose.
At the end of the cycle, the coach may decide that startup is no longer the dominant concern and place greater emphasis on maintaining pace. Subsequent testing should confirm whether that priority is sensible. Longitudinal analysis is a mechanism for gradual programme adjustment rather than a permanent verdict about an athlete.
37. Longitudinal example: Yoke and the load where stability becomes expensive
Consider Yoke trials at 280, 320 and 360 kg. At 280 kg, an athlete maintains even splits with few corrections. At 320 kg, opening acceleration slows but control remains stable. At 360 kg, video reveals greater oscillation and corrective steps in the second half. The change suggests that higher load is associated not merely with uniform slowing, but with the emergence of instability.
A hypothetical 360-kg run has splits of 7.0, 4.6, 5.0 and 6.0 seconds, totalling 22.6 seconds. At 320 kg, the same athlete records 6.1, 4.2, 4.1 and 4.3 seconds, totalling 18.7 seconds. The higher-load deterioration concentrates at the start and finish. More difficult pickup and poorer control are plausible explanations, but repeated observations are needed.
The response is not necessarily to repeat 360-kg trials frequently until technique looks better. In some programmes, moderately loaded skill work and gradual capacity development offer a better stimulus-to-fatigue ratio. The choice depends on experience, current condition and competition timing. The data locate the problem; professional judgment determines sensible loading.
If a later training cycle produces similar opening splits but a faster final section and fewer corrections at 360 kg, that supports an interpretation of event-specific improvement. It need not translate into an equivalent increase in Squat 1RM. Technique, stability and familiarity may account for much of the change.
38. Comparing opponents: tactical value and statistical pitfalls
Opponent split times may provide tactical context during competition. One competitor might excel in pickup while another is stronger over the final metres. Public footage, however, rarely shares identical angles and timing methods. Comparing sections extracted from different broadcasts can introduce errors larger than the differences we are trying to explain.
Official rankings follow official rules. If total time decides placing, the athlete needs the fastest valid completion, not the best isolated split. An extremely aggressive opening that increases drop risk may be a poor choice even when it looks impressive in the first seconds. Opponent analysis must consider the entire task and the consequences of interruption.
When genuinely comparable official data exist, finishing-time distributions and trial variability can be examined. If the leading athletes are separated by less than a second, start and finish definitions and timing quality become particularly important. A delayed hand-timer reaction or inconsistent crossing criterion can undermine an interpretation. Published analysis should distinguish official times from independent video estimates.
Tactical planning should not copy another athlete’s pace blindly. A competitor with exceptional grip may tolerate a different start strategy from one sensitive to handle sway. Opponent data provide external context, but decisions must reflect personal strengths and the precise event configuration. The athlete’s own profile and the official validity criterion remain central.
39. Common errors in Farmer’s and Yoke performance charts
A frequent error is comparing Farmer’s results without specifying whether load is per hand or combined. Another is giving the same name to straight and turning courses. A third is mixing cumulative and individual split times. A fourth is treating mean section speed as instantaneous speed. Each can generate attractive charts and fundamentally wrong conclusions.
Selective data retention is another source of distortion. Keeping only attempts without drops hides information about limits. Recording only fast attempts from good days creates artificial optimism. Changing the pickup definition retrospectively destroys comparability. Methodological discipline is more important than visual polish.
Nor should every performance limitation be reduced to strength. Poor time may result from a faulty start, corrective steps, slippery handles or a badly executed turn. Conversely, visibly smooth technique does not guarantee enough capacity for an extremely heavy frame. A balanced analysis respects physical and technical dimensions without insisting on one explanation for every run.
Finally, avoid overclaiming from small samples. Event-specific strongman studies provide valuable observations but cannot define every individual threshold. Our numerical cases are constructed for teaching. When a hypothetical athlete loses 0.8 seconds at the finish, that illustrates an analytical method rather than reporting an empirical result.
40. Data that make course comparisons possible
Every attempt should retain a unique identifier, date, athlete, event type, apparatus, load, course length, starting configuration and timing method. For Farmer’s Walk, mass per hand must be distinguished from combined mass. For Yoke, record total load including the frame. Turning and drop rules also belong in the record. Without this context, two identical finishing times can represent very different tasks.
Cumulative times should remain separate from individual section durations. Each section links to a precise attempt and distance interval. Missing landmarks are marked as not measured rather than zero. An athlete who abandons after ten metres has an incomplete attempt and a completed distance, not an invented finishing time. Such rules prevent distortions when comparing many months of training or several athletes.
Where retention is permitted and practical, keep raw video as well as derived timings. A section calculation may later be reviewed, but it should be traceable to the original frames and the adopted crossing landmark. A simple, carefully defined table is more useful than a sophisticated model trained on incompatible observations.
41. Automatic checks and computational limits
A spreadsheet can verify that cumulative times rise towards the finish and that individual splits sum to the official result within rounding tolerance. A negative split signals an obvious recording error. Zero distance and missing time must not enter a division used to calculate speed. Unusual results should be flagged for review without automatic deletion; an exceptional performance can be genuine and deserves checking.
Relative time change is 100 × (new time − old time) / old time. A decrease from twenty to eighteen seconds is −10%. For unchanged distance, average speed increases from 1.00 to about 1.11 m/s, approximately +11.1%. Both percentages are correct because travel time and speed are reciprocally related at fixed distance. Explaining this difference prevents misunderstandings in reporting.
Simple warnings could include «course changed», «timing method differs» and «split missing». These rules improve data quality before any statistical modelling begins. Artificial intelligence is not required to recognise obvious incompatibilities. Better prediction starts with removing basic ambiguity from the database.
42. Graphs that serve actual training decisions
For two runs, the most informative graph may compare four five-metre sections side by side. It reveals where the difference arises, not merely who finishes first. A cumulative-time plot shows how seconds accumulate to each landmark. Across weeks, a time series for one fixed load can reveal broad trends, provided changes of apparatus and surface are annotated.
A load–time profile may plot each attempt as a point. There is no obligation to fit regression when observations are sparse. A smooth curve may imply precision that the data cannot support. When a model is used, report attempt count and prediction error in seconds rather than relying on correlation alone. A model is useful if it changes a decision, not merely because it makes an attractive chart.
In public reporting, hypothetical figures should be identified explicitly. Constructed charts can teach analysis but must never be presented as empirical findings. The distinction matters especially in strongman, where event-specific research often relies on small samples.
43. A low-budget club protocol
A tripod, a stable smartphone, a measuring tape and four course markers can support a basic event analysis. The camera must be located outside the athlete’s path. Check visibility of every line and record whether timing starts at a signal, first movement or another explicit event. Before testing, select the landmark used for crossings, such as torso centre or a clearly defined point on the implement. Changing the criterion mid-cycle destroys comparability even if the newer choice seems easier.
Timing from video uses the difference between frame timestamps associated with the crossing landmarks. Practical precision depends on frame rate, resolution, blur and the ability to identify the event consistently. Sixty frames per second provide a nominal frame interval of about 0.0167 seconds, but the total measurement error can be larger. Frame rate alone is not a guarantee that a time rounded to hundredths is accurate to hundredths.
An analyst may repeat the extraction without consulting the first attempt to see whether they select the same frames. When the crossing point is ambiguous, record uncertainty or treat the section as missing rather than manufacture a complete table. A partially populated dataset containing defensible observations is better than a complete dataset filled with unacknowledged guesses.
The protocol can be expanded gradually. A second camera can improve coverage of a turn or reveal lateral sway, but two ordinary views do not automatically create accurate 3D reconstruction. If the question requires precise ground-reaction forces or instantaneous acceleration, additional equipment and validation may be needed. The sophistication of the conclusion should never exceed the capability of the measurement method.
44. Technical video analysis beyond stopwatch values
Alongside split times, an observer can note the onset of sway, corrective steps, handle slipping, altered cadence and repositioning beneath the Yoke. A simple coding scale applied consistently can make such observations comparable across attempts. The scale does not quantify internal muscular forces and must not be presented as a substitute for force plates or a calibrated motion analysis system.
Consider an athlete who repeatedly slows in the last five metres at the same point where lateral corrections become visible. Stability may be involved. Another athlete slows only when a Farmer’s handle begins slipping. Grip-related limitation becomes a leading possibility. Temporal association does not prove causation, but it helps identify what to test next rather than directing every athlete towards the same generic strength exercise.
For stronger interpretation, retain footage from several attempts and note whether the pattern survives small day-to-day variations. An isolated correction during one trial may be accidental. Repeated corrections under the same load, apparatus and surface carry greater practical weight. Even then, the result is observational; training interventions are needed to test whether correcting the pattern changes completion time.
Observers should also record valid attempts that do not fit the preferred hypothesis. If a supposedly unstable athlete completes an excellent run despite visible sway, the explanatory model needs refinement. Data are useful precisely because they challenge familiar assumptions. Video can make discussion between athlete and coach more specific without pretending that every visible event has one simple physical cause.
45. Safety with very heavy carries
Split-time analysis does not justify repeating near-failure efforts when implement control is compromised. An oscillating Yoke may endanger athletes and nearby observers, while dropped Farmer’s implements can create substantial injury risk. Keep the course clear, position assistants safely and ensure cameras or other equipment cannot be struck by a falling or moving implement.
Acute pain, dizziness, unusual breathing difficulty or loss of control require stopping the attempt and seeking appropriate assessment. No potential gain measured in tenths of a second overrides those criteria. The value of performance monitoring depends on operating within a sustainable programme that allows the athlete to keep training over successive weeks and seasons.
Testing volume should be proportional to the information needed. A coach does not need several maximal loaded carries simply to confirm that a five-metre split is slow. Existing training attempts may be sufficient, particularly when the athlete is already under considerable fatigue. Planning the measurement around the session reduces unnecessary exposure.
Safety is also part of data validity. When an athlete has to alter technique to avoid a hazard created by camera placement or spectators, the resulting time no longer represents the intended event. A safe testing environment is therefore both an ethical obligation and a methodological requirement.
46. Verifying transfer: split improvement versus competition result
Repeated improvement at a moderate reference load does not guarantee improvement under competition loading, especially if apparatus and course differ. Split times in standardised sessions are useful monitoring indicators, but event-specific verification remains important. An athlete may improve pickup at moderate loads while still losing pace under a much heavier frame, or become technically more efficient without changing conventional gym personal records.
A mature analysis retains both observed test progress and actual competition outcomes. If they move in different directions, the solution is not to alter the data to protect a convenient theory. Investigate surface, distance, start rules, load, pacing strategy and the athlete’s condition. Divergent results can reveal meaningful limitations in transfer.
When a repeated pattern predicts what occurs at a contest, confidence in its practical usefulness increases. Yet predicting one competition successfully does not create a validated universal model. Strongman has many implements and rule variations, so a profile that works in one event may require recalibration elsewhere. The best system is flexible about models while remaining disciplined about measurement.
Ultimately, applied analysis should answer whether training decisions improve. If tracking the opening five metres changes how pickup is practised and produces reliable event improvements, the measurement earns its place. If a complex indicator never alters decisions and does not describe performance better than simple split times, it may be unnecessary.
47. The final Strongman Data Lab performance report
A useful report after a training block records course layout, apparatus, loading, starting rules, measurement procedure and the observed development of performance. Overall finishing time and individual sections are considered together. Incomplete attempts remain visible. Observations are separated from hypotheses about their causes. If changes exceed known timing variability, confidence in a genuine performance difference may increase; otherwise the observation is retained without unwarranted certainty.
A report should also describe how many attempts contributed to each comparison. A best result from five trials is not directly equivalent to a single attempt performed under otherwise similar conditions. Surface changes, timing-method replacements and revised apparatus should be indicated. Context prevents a technically different test from appearing to be a pure reflection of physiological adaptation.
Between-athlete reporting should not transform ranking into diagnosis. One competitor may be faster under a particular loading but slower with a different frame. Another may have a slow pickup and excellent travel speed. The analysis becomes valuable when it describes the performance profile rather than reducing every athlete to one number. Such distinctions are central to fair interpretation of strongman research.
A strong final report is also explicit about unresolved questions. Did the last section slow because of grip, or because the athlete deliberately protected control? Was a better Yoke time caused by new technique, greater force capacity or simply changed surface? When the data cannot separate alternatives, the report should recommend a comparison that could do so. Good analysis turns uncertainty into a focused research or coaching question.
48. Conclusion: the anatomy of seconds in strongman events
Farmer’s Walk and Yoke can be broken into meaningful phases without pretending that the event is mechanically simple. Pickup, acceleration, established travel, implement control, pauses and finishing behaviour all contribute to one official result. Split analysis turns a finishing number into a profile that can inform training. Nevertheless, not every apparent difference is real, and association between variables does not establish causation.
Published biomechanical research shows that loaded walking has event- and phase-specific characteristics. Early course sections often differ from later movement, with changes in velocity, stride properties and stance behaviour. Existing studies remain limited in scale, however, and do not justify universal thresholds for every athlete. Their strongest practical contribution is methodological: they encourage us to examine how a result is produced rather than merely record it.
Accurate markers, repeatable timing, appropriately positioned video and careful notes can produce more useful information than a sophisticated platform used without clear definitions. The value of technology is not measured by the number of variables it displays, but by whether those variables support better and safer decisions. In practice, three well-controlled indicators may be preferable to thirty poorly defined metrics.
The next episode addresses endurance assessment in repetitive strongman events. Instead of travelling a fixed course, we will examine repetitions against time in Log, Deadlift and other repeated efforts. The same rule will remain: define the measured variable before interpreting the number and distinguish demonstrable observations from plausible explanations.
Scientific references
[1] Keogh, J. W. L., Kattan, A., Logan, S., Bensley, J., Muller, C., & Powell, L. (2014). A Preliminary Kinematic Gait Analysis of a Strongman Event: The Farmers Walk. Sports, 2(1), 24–33. https://doi.org/10.3390/sports2010024
[2] Hindle, B. R., Lorimer, A., Winwood, P., Brimm, D., & Keogh, J. W. L. (2021). The Biomechanical Characteristics of the Strongman Yoke Walk. Frontiers in Sports and Active Living, 3, 670297. https://doi.org/10.3389/fspor.2021.670297
[3] Hindle, B. R., Lorimer, A., Winwood, P., & Keogh, J. W. L. (2019). The Biomechanics and Applications of Strongman Exercises: a Systematic Review. Sports Medicine - Open, 5, 49. https://doi.org/10.1186/s40798-019-0222-z
[4] Winwood, P. W., Cronin, J. B., Brown, S. R., & Keogh, J. W. L. (2014). A Biomechanical Analysis of the Farmers Walk, and Comparison with the Deadlift and Unloaded Walk. International Journal of Sports Science & Coaching, 9(5), 1127–1143. https://doi.org/10.1260/1747-9541.9.5.1127
[5] Bond, C. W., Willaert, E. M., & Noonan, B. C. (2017). Comparison of Three Timing Systems: Reliability and Best Practice Recommendations in Timing Short-Duration Sprints. Journal of Strength and Conditioning Research, 31(4), 1062–1071. https://doi.org/10.1519/JSC.0000000000001566
[6] Multhuaptff, W., Fernández-Peña, E., Moreno-Villanueva, A., et al. (2024). Concurrent-Validity and Reliability of Photocells in Sport: A Systematic Review. Journal of Human Kinetics, 92, 53–71. https://doi.org/10.5114/jhk/174285
[7] Atkinson, G., & Nevill, A. M. (1998). Statistical Methods for Assessing Measurement Error (Reliability) in Variables Relevant to Sports Medicine. Sports Medicine, 26(4), 217–238. https://doi.org/10.2165/00007256-199826040-00002
More From The Journal
Training
The Science of Strongman Training - Episode X: Competition Programming
How to build a complete Strongman competition preparation block: calendar, events, volume, intensity, specificity, simulations, autoregulation, tapering and fatigue management.
Training
The Science of Strongman Training - Episode IX: Peaking
Peaking in Strongman: how to turn months of training into maximal competition performance by reducing fatigue, preserving adaptations and managing specificity.