
Training Science
Series: STRONGMAN DATA LAB: HOW WE MEASURE AND ANALYSE PERFORMANCE - Episode 4: Execution Velocity and Monitoring Strength Development
October 15, 2026
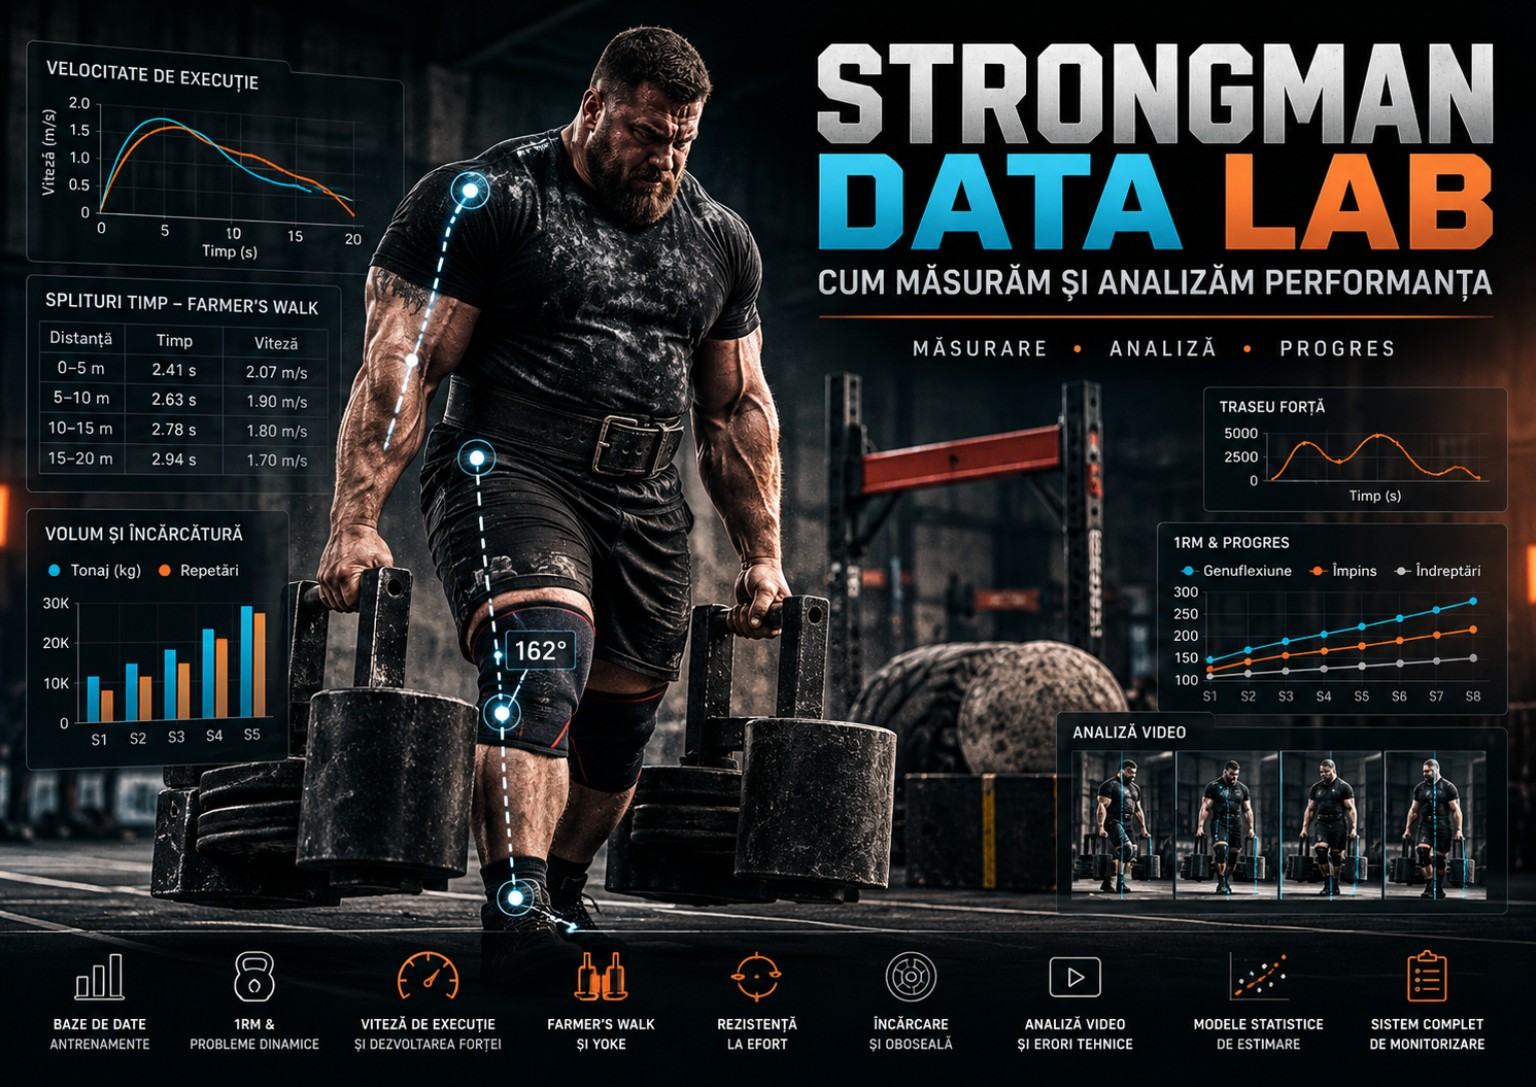
Bar velocity is more than a visual impression. In a strength session, two repetitions performed with the same load may reach different speeds even when the athlete intends maximal effort on both. Sometimes fatigue explains the difference; at other times it is a change in range of motion, technique, intent, position or measurement method. In strongman, where the same competitor might move from Deadlift to Log Lift and then to Yoke Walk, this raises an important question: can execution velocity help us understand strength development without mistaking a device readout for performance itself?
The first three episodes of STRONGMAN DATA LAB defined measurable performance, designed a structured training database and explored why a one-repetition maximum cannot fully predict performance in moving events. Episode Four extends that sequence. We examine execution velocity, load–velocity relationships, velocity changes within sets, estimated mechanical power, device reliability and the process of turning a recorded signal into a sensible coaching decision.
Velocity-based training, usually abbreviated VBT, refers to the use of movement velocity to prescribe, monitor and adjust resistance training. González-Badillo and Sánchez-Medina presented evidence in 2010 of a close relationship between propulsive velocity and relative intensity in a specific Bench Press protocol [1]. The useful message is not that every exercise has the same curve, or that one number in metres per second identifies fatigue in every athlete. It is that velocity, when precisely defined and measured repeatably, can add information to the prescribed external load.
Strongman both enriches and complicates the approach. A Log may be cleaned from the floor and pressed overhead; an Axle may have a different diameter; a Deadlift may use a standard bar, frame or axle; and Farmer’s Walk includes pickup, walking, turns and possible drops. There is no single universal «strongman velocity». There are distinct variables associated with distinct tasks, movement phases and recording protocols.
We will keep three levels separate: what the device observes, what a model calculates and what the coach interprets. A linear encoder may estimate displacement of a point on the bar; a camera may infer motion between frames; an application may report mean velocity. None of these automatically measures the athlete’s internal muscular force. Interpretation requires physics, biomechanics and a candid understanding of equipment limitations.
Every numerical example below is hypothetical and designed for teaching rather than presented as an observation from an identifiable competitor. The cited studies provide broader evidence, but extending Bench Press or Squat findings to Log, Yoke, Farmer’s or Atlas Stones requires care because event-specific validation is limited. A responsible protocol shows the point where direct observation ends and extrapolation begins.
1. Why velocity can reveal something that load alone cannot
A training note reading «Squat, 180 kg, 5 × 3» captures external load and repetition count, but not how those repetitions were executed. The first set could have been fast with consistent depth, whereas the final set might have been slower and less controlled. An established training diary can capture RPE, technique and rest periods. Velocity adds a kinematic observation rather than a definitive judgment about athlete readiness.
Suppose a competitor lifts 160 kg in a standardised squat at a mean concentric velocity of 0.52 m/s early in a training cycle, then records 0.59 m/s six weeks later. If apparatus, depth, preparation, method and conditions remain sufficiently comparable, the change may indicate an improved ability to accelerate the same load. It does not prove that 1RM rose by a specific amount or that the athlete will automatically race faster under Yoke. It is one more useful observation to compare with other results.
Velocity is particularly informative because a fixed working weight is not a fixed relative intensity. A bar weighing 180 kg may represent 80% of one athlete’s capacity during one week and a different percentage later. Available strength fluctuates with recovery, health, psychological context and movement familiarity. Velocity can reflect short-term changes in observed performance, but by itself it cannot establish the cause of those changes.
A second trap is apparent improvement caused by shortening the movement. If the athlete squats shallower or changes the bar path, a higher recorded speed may reflect an easier task rather than improved capacity. Standardising the exercise matters more than the apparent precision of two decimal places. Measurement becomes informative only after the measured task is defined.
Velocity earns a place in coaching when it can influence a real decision: choosing working load, ending a set before technique deteriorates, comparing sessions or evaluating a trend across weeks. If the number is collected without a specific question, VBT can become an expensive digital decoration.
2. What is measured: displacement, velocity, acceleration and time
In kinematics, displacement is the change in position of a point between two moments. Mean velocity across an interval is displacement divided by elapsed time, v = Δx / Δt, for the chosen direction. Mean acceleration is change in velocity divided by elapsed time, a = Δv / Δt. Most portable devices track one primary axis, often vertical, even though the bar, limbs and body centre of mass move through three-dimensional space.
Consider a simple example: a marker on a bar rises by 0.60 metres over 1.20 seconds. Mean velocity over that phase is 0.50 m/s. This arithmetic is correct, but the result does not reveal whether the bar accelerated early and decelerated near lockout. Two repetitions may have the same mean while following very different acceleration profiles. Digital filtering, phase selection and how the start is detected can all alter the reported mean.
We must distinguish mean concentric velocity, mean propulsive velocity and peak velocity. Mean concentric velocity summarises a defined upward movement phase. Mean propulsive velocity considers the portion classified as propulsive according to a biomechanical and algorithmic rule. Peak velocity reports an instantaneous maximum that can be sensitive to sampling and filtering. These outputs must not be mixed in one longitudinal graph without clear labelling.
For Farmer’s Walk or Yoke, travel speed over the course, calculated from distance divided by time, is not the same variable as vertical speed during pickup. A twenty-metre completion time describes overall performance. Five-metre splits reveal where the athlete accelerates or slows. A sensor attached to a handle would follow a different motion again. These observations complement one another without being interchangeable.
A further distinction is whether the output reflects an instantaneous sample, a phase average or an estimate derived from image frames. Confusion arises when devices use the same term for differently defined phases. In a usable database, «velocity = 0.65» is incomplete. Units, method, tracked point, phase and software version are part of the measurement.
3. Force, velocity and power: related but distinct ideas
Net force relates to acceleration through ΣF = m × a in a simplified mechanical description. Vertical lifting also requires accounting for gravity: the external force applied to an implement depends on its mass and acceleration along the axis being analysed. The athlete’s body is a multisegment system, so internal muscular forces cannot be recovered by simply multiplying bar mass by bar acceleration.
Instantaneous mechanical power may be described as the dot product of force and velocity, P = F · v, provided they describe the same system and direction. Observing bar velocity alone does not identify all forces, elastic energy contributions or movement of individual body segments. A device displaying «1000 W» should therefore be judged by the assumptions and equations used to derive that estimate.
In a deliberately idealised example, lifting a 100 kg mass upward at a constant 0.60 m/s involves approximately 100 × 9.81 × 0.60 = 589 W associated with overcoming gravitational weight. This is neither a measurement of total muscular power nor a full account of acceleration. Starting from rest changes velocity and required external force throughout the lift. Pedagogical calculations need explicit assumptions to prevent a convenient approximation becoming an unsupported biomechanical diagnosis.
High maximal strength does not necessarily mean high movement velocity at every load. One athlete may excel at maximal Deadlift but be less proficient at accelerating moderate loads; another may move light implements explosively yet lack sufficient reserve for a very heavy Yoke. Force–velocity characteristics and technical practice contribute to the distinction, but no universal line transfers unchanged between exercises.
External forces in strongman are particularly variable. Yoke adds oscillation; Farmer’s includes grip and handle swing; Truck Pull includes friction and traction; Log Lift combines different movement phases. When a device reports velocity, the first question should not be «how strong am I?», but «which point was tracked, during which phase, and using what calculation?»
4. The load–velocity relationship: why heavier bars usually move more slowly
In many resistance exercises, when the athlete attempts the concentric phase with maximal intent, actual movement velocity declines as the external load increases. This is intuitive, but the shape of the relationship depends on exercise, individual, range of motion and measurement method. González-Badillo and Sánchez-Medina studied 120 resistance-trained men and reported a very close relationship between mean propulsive velocity and percentage of 1RM in a particular Bench Press protocol [1]. The strong coefficient of determination found in that setting does not justify copying the equation to Deadlift, Log or Yoke.
An individual profile is produced using several repetitions at progressively heavier loads, each performed with maximal intent to accelerate without compromising technique. Load is placed on one axis and a precisely defined velocity output on the other. Under controlled testing, points often form a descending relationship. The number and distribution of points, the inclusion of very light loads and the selected regression method can all alter the estimated line.
Consider a hypothetical Squat profile: 100 kg at 0.91 m/s, 140 kg at 0.72 m/s, 180 kg at 0.51 m/s and 200 kg at 0.39 m/s. The sequence illustrates a plausible trend but is not a set of normative values for strongman competitors. Another athlete, with different proportions and technique, may move at different speeds at the same percentage of 1RM. Personal calibration is therefore more defensible than uncritical reliance on a table downloaded from the internet.
The relationship can shift within one athlete. Higher velocities at several fixed loads after a training cycle may support an interpretation of improved ability to accelerate those loads. Improvement limited to lighter loads suggests a narrower adaptation. If only one or two observations change while the rest remain stable, measurement error and technical inconsistency deserve investigation before announcing a new force–velocity profile.
A load–velocity curve works best as an individual monitoring instrument rather than a universal performance label. A model developed for Squat at a given depth and with particular footwear cannot automatically describe Axle Clean, which has discontinuous movement phases. Exercise definition is part of the model, not an optional footnote.
5. Movement intent: why «lift explosively» does not guarantee a fast bar
At high loads, movement may be slow even when the athlete is trying to accelerate maximally. Intent and observed velocity are separate concepts. In load–velocity testing, this distinction is essential: a deliberately slow repetition and a maximally accelerated repetition are not comparable test conditions. Standardised instructions remove one major source of unwanted variation.
A heavy Log Press may look slow yet involve maximal voluntary effort during the drive. Trying to turn the lift into a speed race at any cost can compromise implement path and stability. A useful instruction is not «move chaotically faster», but «maintain the agreed technique and attempt to accelerate maximally during the measured phase». With very heavy implements, safety must take priority over producing an impressive sensor output.
Observed speed also depends on the contraction sequence. A paused Squat is not mechanically identical to a repetition involving a rapid transition between lowering and rising. Stretch-shortening behaviour, tissue elasticity and neuromuscular responses may affect the concentric profile. A Deadlift starting from rest differs from an elastic rebound out of a Squat. Without identifying these conditions, the database may suggest losses or gains that exist only in the testing protocol.
A VBT diary should specify the instruction: «maximal intended concentric speed», «controlled tempo», «two-second pause» or another operational definition. It should also record technical validity and any hesitation. Velocity is an observation; technique quality is an additional assessment, preferably based on explicit criteria or video. Neither observation automatically cancels the other.
6. Mean, propulsive and peak velocity: one repetition, three outputs
Imagine a sensor reporting mean concentric velocity of 0.44 m/s, mean propulsive velocity of 0.51 m/s and peak velocity of 0.86 m/s for the same repetition. These numbers need not conflict: they summarise different portions or features of the same movement. The problem begins when athletes select the most impressive figure and compare it with a previous session recorded using another definition.
VBT research on Squat and Bench Press commonly uses mean or mean propulsive velocity. Depending on loading and technique, part of the ascent may involve braking. A mean across the entire concentric phase therefore differs from a mean across an algorithmically defined propulsive segment. Peak values can be sensitive to transient noise, vibration and filtering. The correct choice is guided by exercise-specific validity and reliability, not by whichever metric produces the highest numbers [2, 3].
Defining concentric onset in Deadlift can be challenging because the athlete takes tension out of the bar and builds force before the plates leave the floor. Some devices start counting from detected movement; others use a speed threshold. Different starting rules yield different averages. A Log Clean and Press contains multiple phases and pauses, making a single global velocity particularly difficult to interpret.
A reproducible protocol selects one primary metric, keeps measurement technology consistent and describes the analysed movement phase clearly. Secondary metrics can be retained, but they should not replace the main longitudinal variable mid-cycle. A quarterly chart must not treat January peak velocities and March mean velocities as identical observations.
There is also a difference between numerical precision and measurement accuracy. A screen may display 0.473 m/s even if between-session methodological variation is far larger than 0.001 m/s. Excessive decimal places imply confidence that the measurement process may not justify. Knowing typical error is usually more valuable than displaying the final digit.
7. Devices: encoders, cameras, inertial sensors and applications
A linear position transducer tracks movement of a cable attached to a point on the bar or implement. Position change over time is processed to estimate velocity. The advantage is comparatively direct measurement along the tracked axis. Problems arise when bar path and cable are misaligned, the apparatus oscillates, the implement rotates or the monitored point does not represent the movement of interest. Even an excellent encoder does not turn a complex Log trajectory into a perfectly vertical bar path.
Inertial measurement units commonly contain accelerometers and gyroscopes and estimate movement from their signals. Placement, calibration, integration drift and vibration can affect results. A sensor fixed to a bar does not capture the same variables as a sensor fixed to the athlete. An algorithm validated for Squat may interpret Farmer’s Walk poorly, because travel is predominantly horizontal while handles also oscillate vertically.
Video offers the additional advantage of technical review. With a known frame rate, calibrated spatial scale, fixed camera and visible target, displacement and elapsed time may be estimated. Perspective distortion, parallax, blur and manual point selection still limit accuracy. A handheld video shot by a friend can support broad technical observations without automatically being accurate enough to interpret a 0.02 m/s change.
A systematic review published in 2026 evaluated commercial smartphone-based velocity applications and reported performance differences across apps, exercises and loading conditions. Some apps met the review authors’ thresholds for applied validity or reliability, without meeting the much stricter research-grade criteria [4]. The practical response is to evaluate the actual device and software version used, not to treat terms such as «AI video tracking» as proof of accuracy.
With a limited budget, a smartphone on a tripod, distance marks and a timing protocol may be entirely appropriate for simple measures such as five-metre splits. This method does not claim to replace three-dimensional laboratory analysis; it gains value through repeatability and matching the method to the question. «Measured from fixed 60-fps video» is more informative than an unsupported claim of «exact velocity».
8. Validity, reliability and agreement: matching tools to decisions
Validity concerns whether a method actually measures the intended construct in the relevant setting. Reliability concerns consistency under comparable conditions. Agreement between devices concerns similarity of absolute outputs, not only whether they rank athletes in the same order. A sensor can be consistent but systematically overestimate velocity. Two systems can also correlate strongly while differing enough in absolute readings to produce different coaching decisions [3, 4].
Suppose one device reports 0.58, 0.60 and 0.59 m/s across three technically similar repetitions while another reports systematically higher values by 0.08 m/s. Both devices might be repeatable, yet the series must not be merged without validated cross-calibration. A phone replacement or software update during the cycle should be recorded as a possible breakpoint in the data.
Coefficient of variation, standard deviation, standard error of measurement and limits of agreement all help describe measurement behaviour. Yet no single threshold makes every sensor suitable for every task. An error of 0.04 m/s might be acceptable for detecting large changes but inadequate for decisions triggered by 0.01 m/s differences. The required precision follows from the decision, not from marketing terminology.
A practical strongman data lab can estimate typical error through familiarisation sessions and repeated measurements at standardised loads. If normal measurement variability is about 0.03 m/s, a difference of 0.01 m/s between two isolated sessions is insufficient grounds for major programming changes. Trends and complementary evidence should be examined before acting.
9. Before recording a number: standardising the conditions
A protocol begins with the exact exercise: bar and apparatus, total external load, personal equipment, footwear, range of motion, grip and technical validity criteria. It then specifies warm-up, rest intervals, number of attempts and the instruction to accelerate. In strongman these details are not administrative perfectionism; they determine whether two numbers represent the same task.
For a simple Squat protocol, we might use two or three repetitions at a reference load after a reproducible warm-up, with enough rest to limit accumulating fatigue. We would record each valid repetition and decide in advance whether the day's indicator is the first repetition, the fastest or the average. We must not change the rule afterwards to obtain a more flattering result.
For Deadlift, start position, stance and the time spent taking tension out of the bar matter. For Log, clean and press should be separated when technology allows. For Yoke and Farmer’s, course length, surface, turn direction, total or per-hand loading, timing start and timing method belong in the record. Without them, numerical comparison becomes storytelling rather than measurement.
Invalid attempts, sensor interruptions and technical anomalies should be retained in the raw log. Quietly deleting an inconvenient repetition distorts the athlete's record. When an observation is excluded from an analysis, the reason must be documented: contact with the bar, obstructed camera, slipping implement or an obvious detection error. A responsible system retains raw observations and explicitly marks analytical exclusions.
Finally, standardisation must be practical rather than impossible. Athletes do not need laboratory conditions every day. They need a realistic protocol they can follow for months. The value of a chart rises with the consistency of the observations behind it.
10. A reference repetition for day-to-day monitoring
The concept of reference velocity begins with a modest question: how does a familiar weight move today when the exercise is executed in a familiar way? We select a load that is sufficiently established not to require maximal exertion, yet relevant to the movement being followed. We then repeat the same testing procedure under reasonably consistent conditions. The test is not a display of courage, nor should it turn warm-up into a competition.
Imagine an athlete recording three Bench Press repetitions at 100 kg on one day: 0.68, 0.66 and 0.67 m/s. Their mean is 0.67 m/s. On another day, readings are 0.64, 0.65 and 0.64 m/s, giving a mean close to 0.643 m/s. The difference is roughly 0.027 m/s. Without knowing protocol error and session context, calling this a meaningful loss of strength would be premature. We can record the discrepancy and see whether it persists.
A stronger practice is comparison with an individual reference distribution rather than a single best result. Typical values and their variability over recent comparable sessions help identify unusual days. Robust estimates, such as medians, can be useful with small datasets or outliers. Whatever method is used, the decision rule should be fixed before inspecting the outcome; a threshold invented after an inconvenient number appears is not rigorous monitoring.
Lower velocity is not synonymous with fatigue. Cautious technique after time away from an exercise, unfamiliar movement, discomfort, different warm-up and sensor problems can change the recorded signal. We should consider perceived effort, sleep, symptoms and video alongside velocity. Sometimes reducing the load is sensible; sometimes the correct response is simply to repeat the measurement.
For strongman, the reference test should be selected for usefulness, not variety. If submaximal Squat provides a meaningful longitudinal marker, twelve separate implement calibrations are unnecessary every week. A few high-quality indicators may outperform a complicated dashboard in which most values are only accidentally comparable.
11. Velocity loss within a set: definition, formula and interpretation
As repetitions accumulate, velocity often declines when the athlete continues to attempt maximal acceleration. One applied metric is percentage velocity loss: VL% = 100 × (v_ref − v_min) / v_ref. The reference may be the fastest valid repetition, the first repetition or another defined value. The minimum may refer to the final or lowest relevant repetition. Unless these choices are specified, percentages from different devices or research papers are difficult to compare.
Consider a hypothetical set at 140 kg with velocities of 0.60, 0.58, 0.55, 0.51 and 0.48 m/s. Taking the fastest repetition as reference, final velocity loss equals (0.60 − 0.48) / 0.60 × 100 = 20%. The observation is a 20% reduction in the selected velocity metric, not a literal «20% muscular fatigue» in physiological terms. It is a relative kinematic change that also depends on load, technique and repetition sequence.
Sánchez-Medina and González-Badillo explored relationships between velocity loss and acute mechanical and metabolic responses using Squat and Bench Press protocols [5]. Their work supports velocity loss as a practical indicator related to accumulating fatigue, but does not provide a physiological conversion factor for every exercise. In strongman, repeated Log cleans, pauses, implement instability and technical sticking points prevent simple transplantation of those thresholds.
Consider also the first attempt in the set. If the first repetition is hesitant and the second is faster, using the fastest as reference produces a different percentage from using the first. Including a technically invalid attempt can distort the estimate further. Retain the complete sequence and establish the analytic rule before extracting one percentage for the chart.
Velocity loss is a programming tool rather than a medical diagnosis. It may help stop sets before technique degrades, but the decision also depends on the training block, joint symptoms and event demands. Imposing one fixed percentage on every movement and every athlete merely replaces one rigid programming habit with another.
12. What research does and does not say about velocity-loss thresholds
Pareja-Blanco and colleagues conducted an eight-week Squat intervention comparing training conditions with velocity-loss thresholds of 20% and 40% [6]. Both groups improved Squat strength similarly, while the 20% condition produced larger improvements in countermovement jump despite fewer total repetitions. The higher-loss condition was associated with greater hypertrophic adaptation in some of the muscle regions assessed. These results belong to the participants and protocol studied, not to a universal law governing strongman.
The message is not that 20% always «wins» or that 40% is universally required for hypertrophy. Outcomes depend on exercise, experience, loading, session frequency and the particular adaptations being evaluated. A block prioritising crisp Push Press repetitions differs from a high-volume back-development block. Strongman demands maximal strength, local endurance and coordination under unusual loading conditions, not a single isolated quality.
An athlete preparing Log for Reps may find it useful to monitor when pressing velocity falls and technique becomes unstable. But any selected threshold requires individual testing rather than copying numbers from a Squat study. Deadlift for Reps performed with full pauses at the floor differs from touch-and-go repetitions. Even the event name does not specify enough without the rules.
Competition changes the decision calculus. During a contest, a competitor may tolerate severe slowing and near-maximal strain to secure a final valid repetition. In a repeated training exposure, the recovery cost of the same choice may be greater than the immediate benefit. Velocity thresholds can help precisely because they force us to decide how many high-quality repetitions we want and how much deterioration we are willing to accept.
Treat percentages such as 10%, 20% and 40% as programming parameters needing justification, not universal biological classifications. If pain, dizziness or loss of control occurs, the set stops regardless of the percentage on the screen. No sensor should overrule basic safety.
13. Predicting 1RM from velocity: promise and uncertainty
VBT applications sometimes estimate 1RM using measured load–velocity pairs and an assumed velocity at maximal load. The attraction is obvious: strength changes could be followed without frequent true maximal tests. Yet the prediction depends on data quality, selected model, exercise and the assumed velocity at 1RM. If these inputs are uncertain, the precision of the final number becomes misleading.
Banyard, Nosaka and Haff assessed load–velocity profiling for estimating Back Squat 1RM and reported substantial individual prediction variability, even though directly measured 1RM was stable in their protocol [7]. A method performing reasonably at group level may still produce errors too large for an individual athlete. Extrapolating towards a maximum is particularly sensitive when only a few heavy-load observations are available.
Suppose a model predicts an estimated Deadlift 1RM of 252 kg. That output is neither a verified personal record nor proof that the athlete will successfully lift 252 kg tomorrow. It should be labelled «estimate from model X, based on observations Y, recorded by device Z». If model error spans several kilograms, presenting 252.43 kg adds no useful information. A plausible interval may be more responsible than a point estimate.
A cautious approach uses reference velocities to monitor trends and occasional direct strength tests when objectives and athlete condition justify them. We do not need a weekly true 1RM to determine whether a fixed load of 180 kg is moving better. The monitoring question can often be answered with a safer and less demanding testing protocol.
Extrapolating Log 1RM from the velocity of a conventional Strict Press is even more questionable. The exercises differ in clean, balance, diameter, coordination and technical validity rules. Prediction models must be validated for the task they claim to predict. A model calibrated in Bench Press is not a universal biomechanical oracle.
14. Monitoring progress: genuine change or statistical noise?
Every performance time series contains biological, technical and instrumental variation. Higher velocity on a given day may represent adaptation, but also a more effective warm-up, shortened movement, displaced sensor or ordinary fluctuation. A single before-and-after comparison is fragile. Repeated standardised observations offer a better chance of recognising a sustained change beyond background noise.
Consider hypothetical weekly means at 150 kg: 0.52, 0.53, 0.51, 0.54, 0.56 and 0.57 m/s. The first three values fluctuate within a narrow range; later values suggest a more sustained increase. We cannot attribute the entire trend to hypertrophy or neural adaptation because the observations do not isolate mechanisms. We can responsibly describe improved observed performance at that specific load.
Contrast that with 0.53, 0.51, 0.55, 0.52, 0.54 and 0.53 m/s. This is variation without a convincing directional trend. Selecting the highest value for a social media graphic may be motivating, but it is not rigorous analysis. Keep all valid attempts, their number, the chosen summary statistic and their spread. More digits are not automatically more truth; the design of the comparison matters.
Atkinson and Nevill described statistical approaches to measurement error in sports variables [8]. A club does not need to perform elaborate laboratory modelling, but should respect the principle: an observed difference has to be interpreted relative to the variability of the method. Saying «performance improved 4%» is unconvincing if the same procedure regularly varies by 6% between sessions.
A useful editorial rule is to distinguish «the data show», «the data suggest» and «the data cannot determine». The first suits a well-defined observation, the second a plausible interpretation, and the third a situation in which error or insufficient control prevents a conclusion. This language protects coaches and athletes from the false certainty of attractive graphs.
15. Personal thresholds, moving averages and decision intervals
A simple monitoring option is a moving average of recent comparable sessions. Rather than reacting to every reading, we estimate the trend across a short window, perhaps the last four sessions. This is a trade-off: a short window reacts quickly but is noisy, while a long window is more stable but may delay recognition of real changes. There is no magic duration suitable for every programme.
Personal thresholds can be developed from variation observed during stable periods, without pretending they are clinical diagnostic criteria. If an athlete generally records 0.60 m/s at a reference load with small fluctuations, a reading of 0.50 m/s deserves investigation of testing conditions and athlete status. A reading of 0.59 m/s may not justify a major decision. The threshold should be connected to known protocol error rather than arbitrary convention.
Each threshold should have a proportionate action. A weak signal may trigger only a training note and additional observation. A moderate signal, confirmed by repeated measurement and unusual perceived effort, could support reduced volume or a technical session. A major signal accompanied by pain or loss of control calls for discontinuing the task and seeking appropriate assessment. These are decision examples, not universal prescriptions.
Training context also matters. A competitor intentionally undergoing a high-fatigue accumulation block may be expected to move more slowly. The same decline after a taper would be more surprising. The chart describes what occurred; the training plan and athlete history help establish a plausible explanation.
A useful system combines flexibility with discipline. It does not ignore fluctuations, but neither does it turn every deviation into a crisis. The goal is to accumulate evidence for coherent decisions over months, rather than govern training reflexively from the latest number displayed on a screen.
16. Squat: useful calibration, not a substitute for strongman events
Squat provides relatively favourable conditions for velocity monitoring: the bar travels predominantly vertically, loads can be standardised and the research literature is richer than for most strongman implements. These advantages do not eliminate important complications. Depth, stance, bar position, footwear, belt use and eccentric timing can alter concentric velocity. Comparisons are meaningful only when movement conditions are sufficiently similar.
For a strongman athlete, Back Squat can serve as an indicator of lower-body strength development and the ability to accelerate specified external loads. Yet Yoke Walk requires dynamic balance and horizontal travel, while Farmer’s adds demanding grip requirements. There is no universally accepted equation converting higher Squat velocity into a guaranteed improvement in Yoke time. Gym-based monitoring results require event-specific verification.
A profile may include four submaximal loads, but those points need not be collected by taking every set to failure. An athlete can use conservatively selected loads after proper warm-up and familiarisation, then monitor the same loads later. Technically invalid attempts and changed range of motion should be tagged separately. The purpose is observation, not a personal record at every testing session.
If velocity at 150 kg rises over time while velocity at 190 kg remains unchanged, we should not assume that the entire profile moved upward. The observation may describe a load-specific change, influenced by movement strategy and error. Comparing several points across a sensible loading range can be more informative than using one load, although more points mean longer and more demanding testing. The protocol should maintain a justified balance between information and effort.
A transition from High-Bar to Low-Bar, changed depth or different knee sleeves creates a new testing condition. Old observations need not be discarded, but they should not be portrayed as a perfectly homogeneous time series. An honest graph can show the break in conditions. Data continuity must not be manufactured by hiding exercise changes.
17. Deadlift: breaking from the floor, sticking regions and bar differences
In Deadlift, the initial phase involves building tension against a stationary external load. A bar can bend before the plates leave the ground, while a sensor attached to the sleeve may capture motion differently from a camera watching the plates rise. An encoder may process early cable displacement differently from video analysis, which may define lift-off as the first clearly visible movement of the load. Such differences influence calculated mean velocity.
A standard power bar, a more flexible deadlift bar and a rigid axle are not kinematically interchangeable. Starting height also matters. A block pull or rack pull has a shorter range and potentially a different load–velocity relationship from a lift starting on the floor. These variations should occupy distinct series in the database. Using rack-pull velocity to calculate a conventional Deadlift record adds an assumption requiring individual validation.
In submaximal monitoring, we might follow the first technically valid repetition at a carefully chosen reference weight. For multiple repetitions, the first lift from a dead stop must be distinguished from repetitions that rebound or merely touch the floor. If competition rules require a full reset, the training protocol should reflect that condition. Mean velocity of a touch-and-go set is not automatic evidence of improvement in a dead-stop event.
Consider a hypothetical athlete recording 0.32 m/s at 200 kg in week one and 0.37 m/s in week six, with unchanged bar, start height and validated range of motion. The difference is approximately 15.6% relative to the initial value. It deserves investigation, but does not mean 1RM necessarily improved by 15.6%. Without a calibrated model and known error, a direct proportional conversion is unjustified.
At high intensities, compensatory movement and changes in bar path can further complicate interpretation. Faster measured movement does not justify overlooking unsafe positions or pain. Video and technical assessment remain important. An impressive number has little value if the protocol loses fidelity to the movement being investigated.
18. Log Lift: dividing the event into meaningful phases
Log Lift exposes the limitations of one overall velocity number. The event may involve bringing the implement onto the thighs, rolling it onto the torso, adjusting position, dipping, driving and locking out overhead. Total time contains active phases and deliberate pauses. A single average cannot tell whether improvement occurred during the clean, the press or the transition between them.
A useful database may distinguish clean duration, setup time before the press and the duration of the overhead drive, provided the video offers reliable phase identification. Not every component has to be measured every day, but definitions should remain stable. In repetition events, we can also record each complete cycle time and whether the implement was lowered or dropped according to the relevant rules.
A sensor following a point on the Log can estimate displacement during the press, but the cylinder may rotate relative to its centre of mass. The consequence depends on sensor type and position. Lateral and frontal video can help clarify technique, although two-dimensional analysis must not be described as a complete three-dimensional reconstruction. If safe sensor installation is impractical, reliable timing of phases is preferable to fragile technological sophistication.
Consider hypothetical cycle times in a five-repetition set: 9.0, 9.5, 10.2, 11.6 and 13.1 seconds. The sequence indicates progressive slowing of the overall task. If pressing duration is stable while the clean becomes slower, the observed limitation may not be overhead force alone. Conversely, consistently quick cleans followed by a progressively slower lockout suggest different technical or strength priorities.
These observations can guide pacing. A short deliberate pause between repetitions might improve the final count of valid lifts, whereas rushing the early cycles may produce subsequent failures. Monitoring does not prescribe one competition strategy; it allows strategies to be tested and compared under controlled conditions.
19. Push Press versus Strict Press: meaningful overhead-strength comparisons
Push Press and Strict Press use different mechanisms to generate and transmit impulse. In Strict Press, deliberate assistance from the lower body is excluded by exercise definition. In Push Press, coordinated dip and leg drive contribute to bar movement. Equal bar velocities at equal loads are not interchangeable indicators of shoulder strength.
Strict Press velocity profiles can track performance without leg assistance, provided range of motion and lockout standards remain stable. In Push Press, velocity depends on dip depth, timing of leg extension and force transfer to the arms. Increased velocity may reflect technical efficiency as well as strength adaptation. In strongman, where coordination is an integral performance capacity, such technical progress is valuable but should be described accurately.
An applied protocol may use separate reference loads and repetitions for the two exercises. We compare a standardised Strict Press with comparable Strict Press sessions, and do the same for Push Press. Repetitions with shortened movement or incomplete lockout should not be mixed into the series without explicit tags. Initial drive velocity and final successful lockout are different observations, although a given device may not distinguish them.
Suppose an athlete retains similar initial Push Press drive velocity but develops more failures near overhead lockout. In that case, launch velocity does not describe the entire problem. Bar path, stability, mobility and coordination may play significant roles. Reviewing video of failed attempts may be more instructive than a chart of mean bar speed alone. The device remains an instrument rather than a referee.
During preparation for maximal Log, barbell Push Press may be monitored as a complementary marker. Yet the Log clean, cylinder geometry and handle placement limit transfer. The most direct verification of improved Log ability is a standardised Log event, not a record inferred from another exercise.
20. Farmer’s Walk: acceleration over the first metres and race pacing
Farmer’s Walk contains at least two mechanically distinct tasks: picking up the implements and travelling while carrying them. Vertical pickup velocity can matter for getting started, but total completion time is also shaped by horizontal acceleration, maintained pace, grip, balance and possible drops. Total time tells us the outcome; intermediate split times help us ask where the outcome was produced.
Take a hypothetical twenty-metre run: the first five metres require 4.2 seconds, the second five 3.5 seconds, the third five 3.7 seconds and the final segment 4.4 seconds. Total time is 15.8 seconds. The slower final split suggests reduced speed or altered pacing, but grip, course setup and placement of markers may contribute. Zero drops do not prove that grip capacity was far from its limit.
Fixed side or oblique video with visible markers at five-metre intervals supports basic pacing analysis. The timing start must be defined: starting signal, first implement movement or crossing a line. The same rule should be used every time. Differences of a few tenths of a second can arise from hand timing, and small improvements may fall within the normal variation of the procedure.
An athlete who improves pickup velocity may reduce the time spent starting without becoming faster during travel. Another may pick up more slowly yet gain time by accelerating effectively after the first steps. «Strength increased» is therefore often too broad an interpretation. Splits can help separate a poor start from declining speed at the end of the course.
Comparable sessions require details of mass per hand, handle length and height, grip diameter, footwear, surface and rules governing drops. Two runs with 130 kg per hand may have different demands if implements or terrain differ. A mature data lab looks for comparisons that remain valid six months later, not merely numbers impressive enough for a caption.
21. Yoke Walk: horizontal speed within an unstable system
In Yoke, the athlete does more than lift a load. The task involves stabilising a tall frame that may oscillate in multiple planes while the body travels forward. Initial acceleration must be balanced against control of sway; excessive speed without stability can produce corrective steps or a dropped implement. Mean travel speed alone may hide precisely the technical limitation responsible for the result.
The course can be divided into pickup, acceleration, maintenance and finish. Five-metre split times may be accompanied by visible technical observations: large lateral sway, very short steps, contact with the ground or changes of direction. Complex algorithms are unnecessary for a first assessment. A fixed camera and clear distance markers already turn one finishing time into a more informative course profile.
Consider two hypothetical runs at the same weight on the same surface. Athlete A finishes in 14.8 seconds after a controlled acceleration with no drops. Athlete B finishes in 15.3 seconds after an aggressive start followed by excessive sway and corrective steps. The evidence does not establish that A is maximally stronger; it indicates that A managed that particular task more efficiently. Technical change can improve event performance without detectable changes in 1RM.
If the competition course is twenty metres, split analysis is more event-specific than Squat bar velocity. Yet both have distinct uses: the former measures travel efficiency, while the latter monitors the acceleration of a standardised vertical load. Intelligent integration does not require merging both into a mysterious single score. It requires interpreting each alongside the intended objective.
Over time, an athlete can monitor whether gains occur in pickup, sustained speed or control of sway. If overall time remains unchanged while movement becomes visibly more stable, a useful technical adaptation may precede a measurable finishing-time improvement. Observational data cannot automatically prove causation, but they can guide the next round of testing.
22. Tire Flip and Atlas Stones: why barbell models should not be forced onto every event
Tire Flip is a compound task in which hand positions, force direction and contact points change during each repetition. The tyre rotates around changing support geometry rather than travelling continuously along one vertical axis. A sensor attached to an arbitrary point may report velocity dominated by rotational geometry rather than the athlete’s capacity. A barbell tracking algorithm can become misleading unless its application has a specific biomechanical justification.
For Tire Flip, duration of individual flips and pauses between them may be easier to standardise than an instantaneous speed assigned to the whole movement. We can distinguish time to initial break from the ground, movement towards an upright tyre and preparation for the next attempt. Fixed video can identify these phases without pretending to measure internal muscular forces directly.
Atlas Stones pose different difficulties: pickup, lap position, hip extension and loading onto a platform. Estimating the centre of the stone requires consistent tracking and perspective control. Adhesive substances, sphere diameter, platform height and chosen technique affect the task. Two stones of identical mass need not impose identical technical demands.
An applied analysis might record time per successful load, pauses, failed attempts and visible technical patterns. If the athlete becomes faster at transitioning from the lap to the platform, that is an observable improvement even without 3D velocity data. Coaches may add video markers to estimate a trajectory, but the uncertainty must be declared, and the results must not be presented as equivalent to laboratory motion capture.
The principle is straightforward: do not impose one measure on every event merely because a device can display it. In a varied sport, technological maturity includes selecting the metric that best represents the task. For some events, a reliable stopwatch may be more applicable than an algorithm producing an ambiguously defined velocity.
23. Sandbags, loading medleys and transition speed
A Loading Medley may combine bags, stones, barrels and other implements carried and loaded onto platforms. Finishing time depends on several sequences: pickup, transport, orientation at the platform, loading, return to the next object and management of pauses. Overall time can confirm improvement but may fail to identify the part that improved. Phase-level information supports more specific coaching decisions.
A simple protocol can create a record for each object: mass, dimensions, distance to platform, platform height, pickup duration, carry duration, loading duration and transition time. Sensors need not be attached to every bag. A camera covering distance markers and the platform may supply sufficient landmarks. Times can be extracted after training and verified against video timestamps.
Imagine a hypothetical three-bag medley involving 70, 90 and 110 kg. An athlete completes it in 45 seconds, then 40 seconds several weeks later. Segment analysis might reveal similar pickup and carry times for the first two bags, with the entire improvement arising from a cleaner final load and shorter transitions. Recording only total time might incorrectly direct the athlete towards running speed rather than loading technique.
Conditions must also be documented. A newly filled, compact bag may be easier to control than a deformable or slippery one with the same mass. Tacky, chalk, covering material and object order can change the challenge. Proper comparison follows the exact task variation. If the platform or distance changes, the result remains valuable but belongs to a different testing condition.
In medley events, «execution velocity» becomes a family of measures: metres per second during travel, seconds per object, seconds per transition and valid repetitions per time window. This variety is not a methodological weakness. It reflects a sport in which transitions, equipment and coordination shape performance as much as repeated identical movements.
24. Autoregulating loads with velocity information
Autoregulation means modifying session parameters using available information about current performance while respecting the programme objective. Rather than imposing a fixed weight regardless of conditions, a coach might use a previously observed velocity target to guide load selection. This approach is discussed in applied VBT literature [2], but its effectiveness depends on calibrated profiles and sensible decisions.
Suppose an athlete usually squats 160 kg at approximately 0.55 m/s. On one day, after consistent warm-up and two controlled attempts, the athlete records 0.47 m/s and reports unusual effort. One option is lowering the load to preserve the intended technical velocity. Another, depending on session objective and athlete health, might be completing a modified technical session. No single response is correct in every context.
Conversely, a higher velocity reading does not require immediate loading increases. During a controlled volume or recovery block, raising intensity may contradict the reason the session was programmed. A velocity sensor does not know the entire competition calendar. Its role is to help check whether a prescribed dose produces the expected observable demand, not to turn every good day into a maximal attempt.
Autoregulation may combine velocity with RPE, repetitions in reserve, movement quality and event-specific difficulty. If the sources disagree, there is no need to assume one is false. An athlete may perceive a weight as difficult because of discomfort while the bar still moves rapidly. Another may report that a lift felt easy while subtly altering technique. Disagreement merits investigation rather than dismissal of athlete experience.
A basic autoregulation process has three stages: check signal quality, compare against the athlete’s own reference and select a proportionate adjustment aligned with the day’s purpose. Over time, the rule should be evaluated retrospectively: did training become more consistent, did failed attempts decrease, and did actual performance improve? Without feedback about consequences, rigid application remains preference disguised as statistics.
25. Velocity and fatigue: indirect signal, not diagnosis
Fatigue has multiple dimensions. Force production can be influenced by peripheral and central factors, while perceived effort, coordination and pain tolerance are distinct phenomena. Repetition velocity reflects mechanical behaviour during a test. It can be sensitive to athlete readiness, but it does not independently identify a physiological mechanism or distinguish normal training response from a health problem.
Suppose an athlete moves Bench Press more slowly but feels well and performs normally in Farmer’s Walk. The change may reflect local fatigue, measurement fluctuation or altered technique. If velocity declines across several standardised tasks and the athlete also reports poor sleep and unusually high RPE, an interpretation of reduced general readiness becomes more plausible. Even then, a sports monitoring dataset does not establish a medical diagnosis.
Saw, Main and Gastin highlighted the usefulness of subjective self-reported information for monitoring training responses [9]. It is an important reminder to technology enthusiasts: a well-chosen question repeated consistently may be more useful than a new sensor. Combining velocity with load records and athlete perception can reduce simplistic explanations.
For repetition events, the changing duration of individual repetitions is also useful. Deadlift for Reps may begin with several similar lifts and then show progressively longer repetition times. That pattern provides information about fatigue tolerance within the specific task. But valid repetition count and available event time remain separate competitive outcomes. A strategic pause for breathing is not necessarily a direct marker of immediate muscular failure.
Unexplained persistent performance changes accompanied by symptoms should prompt appropriate clinical assessment. VBT does not replace history taking, examination or recovery management. A useful indicator is one whose limitations are respected when the evidence no longer supports a confident conclusion.
26. Integrating VBT into a strongman microcycle without excessive testing
A sound microcycle develops different qualities: maximal strength, muscle mass, technical skill and event performance. VBT can begin with one selected exercise rather than obsessive monitoring of every repetition. A Squat day could include two reference repetitions, while overhead training tracks Push Press or Strict Press separately. Event sessions may rely on split times rather than vertical velocity estimates of complex implements.
If Monday focuses on pressing, Tuesday on Squat, Wednesday on pulling and the weekend on strongman events, a small set of weekly reference measures may be practical. The goal is not to add so much testing that training becomes a continuous assessment programme with inadequate recovery. Measurement should provide more benefit than its cost in setup time and the fatigue it creates.
During high-volume accumulation, moderately lower velocities may be consistent with expected fatigue. During intensification, maintaining the speed of first repetitions at increasing loads could be of interest. During a taper, reference measurements might help identify improved readiness, provided the test is not changed near competition. These are plausible applications rather than universally validated strongman protocols.
Farmer’s and Yoke sessions could include one moderately loaded standardised attempt before the main event work, but only if it is safe and does not interfere with the session goal. Very heavy implements may require less frequent testing. Where additional testing would create unnecessary fatigue, existing programmed attempts can often supply the monitoring data.
The principle is to use VBT to clarify the training programme, not to build a parallel laboratory that competes with sport preparation. Competition performance, training quality and athlete health remain the final objectives. Monitoring is a support tool rather than the purpose of the week.
27. Frequent interpretation errors in velocity-based training
The first error is treating one reading as a diagnosis of strength or fatigue. The second is changing devices without calibration. The third is comparing different exercises through identical velocity thresholds. The fourth is ignoring changes in range of motion or technique. These mistakes are attractive because they produce clean graphs and dramatic conclusions. Mathematical simplicity does not guarantee biomechanical accuracy.
Another error is making velocity an objective disconnected from competition. An athlete might try to accelerate every implement at all costs, sacrificing execution quality to produce a bigger number. Another might refuse justified load progression because the sensor has not reached an arbitrary target. Training decisions should begin with the actual objective, consider the velocity signal and be judged by subsequent performance.
A third problem is selective data retention. Keeping only the fastest repetitions from good days while discarding poor sessions makes progress appear inevitable. Changing the exclusion threshold retrospectively can manufacture convenient conclusions. A written protocol established before collection and retention of raw observations reduce this risk. Imperfect recordings can be marked as such without being erased.
Correlation is also easily confused with causation. If Squat velocity improves alongside Yoke time, that does not establish that the first change caused the second. Specific training, technique refinement, body-mass changes and experience may all contribute. Responsible analysis develops testable hypotheses rather than definitive stories built from two improving trend lines.
Finally, continuous surveillance can become costly without practical benefit. A complicated monitoring system demands setup, data cleaning and interpretation. If these costs exceed the benefits for the athlete, simplify it. Professionalism is not measured by the number of indicators, but by the quality of the decisions they help support.
28. Practical calibration with limited resources
Not every gym has linear transducers, high-speed cameras and biomechanics specialists. A useful system can still begin with two smartphones, a stable tripod, distance markers and a well-organised file. The first decision is what to monitor. If the objective is timing a twenty-metre course, a stopwatch and two clear lines may be sufficient. Detecting tiny changes in concentric Squat velocity demands substantially more technical control.
For video analysis, the camera should be fixed safely outside the movement area, preferably perpendicular to the main plane of motion when performing two-dimensional tracking. An object of known length can provide spatial calibration, but only in the plane occupied by the tracked target. If the athlete moves towards or away from the camera, or if the implement rotates, perspective error increases. Attractive footage is not automatically good measurement footage.
At 60 frames per second, consecutive frames are approximately 0.0167 seconds apart; at 120 frames per second, the interval is about 0.0083 seconds. This does not mean final timing precision automatically equals the frame interval. Event onset can be ambiguous, while spatial tracking depends on blur, resolution and camera angle. Additional frames can help, but they do not remove all other sources of error.
For course splits, distance marks and the crossing criterion must be defined. In Farmer’s Walk, whether timing stops when the first handle, athlete’s body or final handle crosses the line changes the result. Consistency matters more than an unsupported claim of hundredth-of-a-second precision. For hand timing, comparing independent readings from the same recording helps characterise variation.
A pilot phase should repeat the same test over several comparable sessions and estimate normal variability. If error is too large to detect the change we care about, the solution is not to hide the limitation. We can improve the setup, change equipment or simplify the question. A competent data lab can state when a variable cannot be measured reliably with available tools.
29. Hypothetical case study: six weeks of Squat development
Imagine an athlete tracking the first valid repetition at 160 kg after an unchanged warm-up. Weekly velocities are 0.49, 0.50, 0.51, 0.50, 0.53 and 0.55 m/s. Reported RPE values are 7.5, 7.5, 7, 7, 6.5 and 6.5. The profile suggests better ability to accelerate the reference load, alongside lower perceived difficulty. We have not yet established whether the difference exceeds protocol error or how much reflects physiological adaptation versus familiarisation.
We can verify the observation by including two additional standardised loads, perhaps 120 and 180 kg, if compatible with training. If velocity improves at all three loads while technique stays comparable, confidence in the trend increases. If only 160 kg improves, interpretation must remain load-specific. In neither case should an observed 0.06 m/s change automatically become a precise increase in estimated 1RM.
Now suppose the athlete’s time for a twenty-metre Yoke run at a fixed load improves from 21.0 to 19.4 seconds. Split analysis shows similar pickup performance but faster final ten metres. It would be tempting to argue that Squat improvement caused faster Yoke. However, the athlete also practised Yoke, refined stride rhythm and became more confident stabilising the frame. An observational series cannot isolate these contributions.
The appropriate conclusion is modest: the athlete moved faster in Yoke and completed reference Squat repetitions more quickly under the observed conditions. Future data may test whether a particular Squat marker predicts improvement in Yoke time, but that hypothesis requires more observations and control of other variables. Without that process, the interpretation remains plausible rather than demonstrated.
30. Hypothetical case study: Log Lift and technical versus physical improvement
An athlete prepares for Log for Reps at 100 kg, targeting six valid lifts within 75 seconds. In the first session, five lifts are completed in 70 seconds, followed by a failed sixth attempt. Four weeks later, the athlete completes six lifts in 68 seconds. Event outcome has improved, but why? We examine clean duration, setup time and the pressing phase where the video permits reliable segmentation.
In our hypothetical example, pressing velocity for the first two repetitions is broadly stable while average clean time declines. The athlete positions elbows more effectively and eliminates unnecessary readjustments. This suggests observable technical improvement. Successfully completing the sixth repetition may also reflect better local endurance or pacing, alongside technical changes.
A coach might retain overhead strength work while giving additional attention to the clean-to-rack transition. This is not an automatic algorithmic instruction; it is a judgment informed by data and biomechanics. If video coverage is incomplete, missing phase durations should remain missing rather than fabricated to fill the spreadsheet.
Another athlete might demonstrate the opposite pattern: stable clean speed but progressively slower presses and repeated lockout failures. In that case, rest strategy and overhead-strength development deserve further testing. The observations do not choose the method, but they narrow the range of plausible coaching hypotheses.
31. Minimum database structure for velocity records
A velocity monitoring file requires athlete identifier, timestamp, standardised exercise name, exercise variation, load, units, device and software version. For each repetition, record its set position, metric type, value, technical validity and relevant comments. When movement contains discontinuous phases, the phase must be stated. Without these fields, the history can become ambiguous even to the person who originally collected it.
For example, a hypothetical entry could read: athlete A; 15 October 2026; High-Bar Squat; 160 kg; repetition 1; mean concentric velocity 0.55 m/s; linear encoder; valid depth; no pain; standard rest period. A Farmer’s record should use a different output structure: 120 kg per hand; twenty metres; stationary start; 16.4 seconds; no drops; surface specified. These are not interchangeable observations for an anonymous column labelled «velocity».
For multi-repetition sets, retain each repetition or a structure from which the whole sequence can be reconstructed. Keeping only maximum and minimum speed loses the intermediate trajectory and prevents verification of the reference choice. Similarly, keeping only Farmer’s total time makes later split reconstruction impossible once video is deleted.
Missingness and error require explicit rules. «Not measured» is not zero; «invalid repetition» is not equivalent to «device malfunction»; «did not attempt» differs from «attempted and failed». These distinctions prevent statistical outputs that are beautifully precise and fundamentally wrong. Data structure protects against accidental conclusions more effectively than sophisticated charts.
Privacy and security matter too. Avoid collecting unnecessary personal information, and manage who can access recordings. Videos may include identifiable bystanders and locations. A sports monitoring system should be useful without creating unlimited surveillance. Data retention and deletion policies belong in the system design.
32. Formulas and automated checks in a simple spreadsheet
A spreadsheet can calculate course speed by dividing distance by elapsed time, but must know whether elapsed time includes pickup. For twenty metres in sixteen seconds, global average speed is 1.25 m/s. If the first three seconds involve pickup and initial acceleration, mean travel speed over a selected later phase may differ. Excluding an inconvenient phase requires changing the variable's label and definition.
Relative change from a baseline is Δ% = 100 × (new value − old value) / old value. An increase from 0.50 to 0.55 m/s is +10%. A decrease from twenty to eighteen seconds is −10% in time, while average speed increases by approximately 11.1% over unchanged distance. Both percentages are mathematically correct because time and speed are reciprocal at fixed distance.
Within-set velocity loss follows the formula defined earlier and requires raw repetition data. If initial velocity is zero because of a sensor failure, the spreadsheet should return «cannot calculate» rather than infinity or an invented result. Negative durations, missing loads and implausible distances should be reviewed before analysis. Numerical validation is part of sporting data validation.
Useful plots include reference-load velocity against date, velocity changes across a set, and split times for Yoke or Farmer’s. Changes of equipment, measurement method and training period should be annotated. An uninterrupted line can disguise the fact that the protocol changed halfway through the observation period.
A practical rule is that a derived calculation cannot be more trustworthy than the observations from which it comes. A clean spreadsheet can transform inconsistent source data into perfectly formatted statistics, but that is a visual improvement, not an improvement in knowledge.
33. Testing whether monitoring actually improves decisions
Monitoring should be evaluated by its consequences rather than record count. After eight or twelve weeks, a coach can ask whether it reduced avoidable failed attempts, improved volume regulation, increased event consistency or explained stagnation. Not every change can be attributed to monitoring, but its practical contribution can still be examined.
A coach might hypothesise that reference Squat velocity improves daily load selection. To evaluate the idea, the coach could retain the decisions taken, the subsequent outcomes and whether the decision would have differed without the signal. If the sensor never changes a decision, perhaps its current function is documentation rather than autoregulation. That does not make it useless, but its role should be stated accurately.
For moving events, split analysis can be assessed by whether it identifies limitations responsive to specific training. If Farmer’s improvements occur chiefly in the first five metres after a period focused on pickup and acceleration, the observation supports the practical relevance of that training block without independently establishing causality. Repeating such comparisons across several cycles can build local confidence.
A mature system includes a category for «no clear effect». Not every intervention works, and not every metric generates a useful insight. If monitoring creates false alarms, consumes practice time or increases unnecessary stress, it should be simplified. Strong data culture accepts negative results and retains only measures that justify their burden.
Once decisions become testable and repeatable, technology is no longer merely a performance accessory. The question determines the measurement, the measurement is checked, and its interpretation guides an intervention whose outcome is later evaluated. That is the foundation of a functioning Strongman Data Lab.
34. From simple indicators to statistical models: when complexity is justified
A mature database can investigate relationships among reference-load velocity, event time and changing training volume. Yet the ability to run a regression does not mean enough data exist for a useful prediction. A model with ten variables fitted to twelve sessions is likely to describe features of that small sample rather than a reproducible relationship. Overfitting matters in applied sport: predictions that look impressive in retrospect can fail at the next competition.
A cautious process first asks whether a simple model is adequate. The mean of the last three Farmer’s attempts on unchanged apparatus may predict subsequent performance more reliably than a complex algorithm combining Squat, body mass and poorly validated sensors. If adding a variable improves only the sessions used to fit the model, but not observations held aside for testing, its value is doubtful.
Prediction error should be expressed in meaningful units: seconds during Yoke, validated Log repetitions or kilograms in a strength event. A high correlation coefficient can coexist with serious absolute disagreement. Bland and Altman demonstrated why agreement between measurement methods must not be reduced to correlation alone [11]. Athletes need to know whether a prediction is accurate enough to influence a decision, not merely whether two curves look similar.
Changed competition rules or equipment can also interrupt a longitudinal relationship. We must record these conditions or analyse the periods separately. There is no justification for mathematically «correcting» an asphalt Yoke time into a rubber-floor equivalent without evidence that the adjustment works. A transparent, modest and testable model is preferable to an elegant model that cannot be explained.
When studying several athletes, preserve individual differences. A relationship observed between people does not automatically describe within-athlete development. Group averages cannot substitute for a competitor's own history when planning a contest. The data lab should therefore be built around athlete, event and testing condition rather than one universal equation.
35. Individual differences: anthropometry, experience and movement style
Athletes do not share identical body geometry. Height, limb length, trunk dimensions, body mass and mobility influence possible movement paths. A technically valid Squat may cover different bar displacement distances for athletes with similar 1RM values. Velocity at a percentage of 1RM is therefore not a pure measure of muscle quality isolated from biomechanics.
Winwood, Keogh and Harris examined relationships between maximal strength, anthropometry and strongman-event outcomes in a specific sample of resistance-trained participants [10]. Studies like this support a multidimensional view of performance without producing a universal key for every competitor. Group results require interpretation in relation to the original sample, and an experienced strongman may behave differently from a novice.
An athlete with long arms may move the bar through a different Bench Press path. Another with efficient Log technique may achieve lockout through different coordination. We should not «correct» such differences by superficial comparison with another athlete’s velocity norms. Longitudinal comparisons against one's own standardised movement are often more useful for individual development.
Experience also affects measurement consistency. Early in skill acquisition, technical variability may be considerable. After months of practice, the movement becomes more repeatable. This stabilisation is itself valuable information, but should not be mistaken for an equivalent proportional increase in maximal strength. Monitoring can document both improved kinematic performance and increased movement consistency.
Between-athlete comparisons should be reserved for sufficiently homogeneous conditions, while individual training decisions prioritise personal history. Velocity becomes useful precisely when we acknowledge that different bodies and movement styles are not identical copies of the same machine.
36. Health, safety and the limits of automated decisions
Performance monitoring is not medical assessment. Acute pain, dizziness, cardiovascular symptoms, loss of implement control and major technical deterioration demand priorities different from reaching a target velocity. An algorithm cannot independently establish whether a performance change reflects training stress, illness, dehydration or a condition requiring medical evaluation. Automated thresholds therefore need explicit safety overrides.
Strongman increases the consequences of careless decisions. A missed Yoke step can compromise control of a very heavy frame. Rushing a Log overhead may damage the stability of the final position. Repeating increasingly slow Deadlifts with visibly deteriorating technique may create unnecessary risk. Neither a small velocity increase nor an attractive statistical trend justifies ignoring evident danger.
The International Olympic Committee consensus on training load and injury risk emphasised load management, athlete context and well-being [13]. VBT may contribute an additional indicator, but a kinematic signal is not a complete injury-risk assessment. Information on pain or other symptoms, if collected, should be handled confidentially and under applicable data-protection standards.
In remote coaching, it should be clear who verifies repetitions and who decides whether loads can be adjusted. An automatic instruction to «add 10 kg» may be inappropriate if technique has deteriorated or the athlete reports pain. Responsible systems retain meaningful human oversight. Measurement does not transfer accountability to software.
The objective is sustainability across training cycles and competitions, not optimisation of one filmed repetition. If technology pushes athletes towards unnecessarily heavy attempts simply to improve a chart, implementation has failed regardless of how sophisticated the application appears.
37. An operational protocol for a personal Strongman Data Lab
During week one, select two or three variables that answer genuine questions. An example is reference velocity at 150 kg Squat, timing of one standardised Farmer’s attempt and Yoke split times. For each variable, write its definition, test conditions, apparatus, warm-up and recording method. Missing observations remain missing, and the first training block can be regarded as exploratory until the method proves repeatable.
During week two, examine practical reliability. Repeat conditions when compatible with training, inspect footage and observe how much values vary without an obvious change in capacity. If nearly identical repetitions generate very different readings, investigate. Camera placement, cable tension or a subtle change in range of motion may be responsible. Skipping this stage turns thresholds into guesswork.
Over the next four to eight weeks, collect data without constantly changing the rules. Record volume, intensity, RPE and major technical changes alongside velocity. Produce simple graphs with restrained comments: «reference-load velocity rose during the last three sessions» or «overall Farmer’s time remained stable, while the final five metres became slower». Describe observations before proposing physiological explanations.
At the end of the block, compare metrics with event outcomes, objectives and recovery. If improved reference velocity is not reflected in competition tasks, examine event-specific technique and possible transfer limitations. If event performance improves while Squat velocity remains stable, accept that transfer is not automatic. Do not retroactively redefine success so every result appears to confirm the system.
After the first cycle, keep metrics that support decisions and remove those that consume time without adding value. Repeat this simplification process. A modest system with clean data and explicit questions can serve an athlete better than an expensive platform full of admired but unused graphs.
38. Questions that every published velocity graph should withstand
Before publishing a graph, its author should be able to answer a series of questions. What exact exercise and variation were measured? What does «velocity» mean in this dataset? What load and units were used? How were valid repetitions selected? Were equipment, software, range of motion and testing conditions consistent? Unanswered questions require explicit qualification of the result.
Next, does the observed difference exceed known method variability? Is there a pattern across sessions or one unusual point? How does the variable relate to competition performance? Did other factors change at the same time and potentially explain the result? These questions do not make analysis inaccessible. They make it more accurate and fair to readers.
When comparing devices, examine agreement rather than correlation alone, and correctly specify the reliability statistic used [11, 12]. When estimating 1RM from velocity, report the modelling method, limitations and potential for large individual errors [7]. When using smartphone applications, identify software versions and the conditions covered by validation evidence [4]. Transparent reporting allows readers to judge the strength of a claim.
Hypothetical teaching examples must be visibly distinguished from empirical data. It is appropriate to describe an athlete A improving Farmer’s time, but inappropriate to present the invented example as a research finding. Similarly, velocity values reported for Bench Press cannot become normative Axle or Log thresholds without event-specific validation. Editorial quality extends methodological quality.
A data lab need not pretend certainty. It needs to say what is known, how well it is known and what should be investigated next. In a sport this complex, intellectual clarity is more valuable than one extra decimal place.
39. Conclusion: velocity helps us understand strength, but cannot replace it
Execution velocity can reveal changes invisible in a conventional load-and-repetition diary. It helps describe load–performance relationships, velocity loss within a set and an athlete’s ability to accelerate fixed reference loads. It may support autoregulation and trend monitoring when a repeatable protocol exists and measurement error is understood.
Velocity is not maximal strength, however, and a faster repetition does not guarantee a better Yoke, Farmer’s, Truck Pull or Log result. Strongman requires strength, technique, stability, local endurance, implement-specific geometry and adherence to competition rules. The more complex the task, the more carefully its performance variable must be defined. Sometimes vertical bar speed is appropriate; sometimes a five-metre split or a transition duration is more informative.
Good methodology separates observation from interpretation and tests data against athlete experience. We do not aim to replace a coach’s judgment, invalidate athlete perception or produce dramatic forecasts from incomplete observations. We aim for disciplined comparison. A small number of well-defined measures may offer more knowledge than hundreds of charts collected without a protocol.
The next episode will move from repetition speed to the anatomy of a race: Farmer’s Walk and Yoke studied through split times, acceleration, slowing phases and control of implement sway. We will move from bar movement to athlete movement under load and develop numerical examples for direct application in training. Until then, the most useful question for every new sensor is: which real decision will improve because I have this information?
Selected scientific references
[1] González-Badillo, J. J., & Sánchez-Medina, L. (2010). Movement Velocity as a Measure of Loading Intensity in Resistance Training. International Journal of Sports Medicine, 31(5), 347–352. https://doi.org/10.1055/s-0030-1248333
[2] Weakley, J., Mann, B., Banyard, H., McLaren, S., Scott, T., & Garcia-Ramos, A. (2021). Velocity-Based Training: From Theory to Application. Strength and Conditioning Journal, 43(2), 31–49. https://doi.org/10.1519/SSC.0000000000000560
[3] Moreno-Villanueva, A., Pino-Ortega, J., & Rico-González, M. (2024). Validity and Reliability of Linear Position Transducers and Linear Velocity Transducers: A Systematic Review. Sports Biomechanics, 23(10), 1340–1369. https://doi.org/10.1080/14763141.2021.1988136
[4] Puppyn, N., & Brughelli, M. (2026). The Validity and Reliability of Commercially Available Smartphone-Based Velocity-Based Training Applications: A Systematic Review With Guidance for Research and Practice. International Journal of Sports Science & Coaching. https://doi.org/10.1177/17479541261447622
[5] Sánchez-Medina, L., & González-Badillo, J. J. (2011). Velocity Loss as an Indicator of Neuromuscular Fatigue During Resistance Training. Medicine & Science in Sports & Exercise, 43(9), 1725–1734. https://doi.org/10.1249/MSS.0b013e318213f880
[6] Pareja-Blanco, F., Rodríguez-Rosell, D., Sánchez-Medina, L., et al. (2017). Effects of Velocity Loss During Resistance Training on Athletic Performance, Strength Gains and Muscle Adaptations. Scandinavian Journal of Medicine & Science in Sports, 27(7), 724–735. https://doi.org/10.1111/sms.12678
[7] Banyard, H. G., Nosaka, K., & Haff, G. G. (2017). Reliability and Validity of the Load–Velocity Relationship to Predict the 1RM Back Squat. Journal of Strength and Conditioning Research, 31(7), 1897–1904. https://doi.org/10.1519/JSC.0000000000001657
[8] Atkinson, G., & Nevill, A. M. (1998). Statistical Methods for Assessing Measurement Error (Reliability) in Variables Relevant to Sports Medicine. Sports Medicine, 26(4), 217–238. https://doi.org/10.2165/00007256-199826040-00002
[9] Saw, A. E., Main, L. C., & Gastin, P. B. (2016). Monitoring the Athlete Training Response: Subjective Self-Reported Measures Trump Commonly Used Objective Measures: A Systematic Review. British Journal of Sports Medicine, 50(5), 281–291. https://doi.org/10.1136/bjsports-2015-094758
[10] Winwood, P. W., Keogh, J. W. L., & Harris, N. K. (2012). Interrelationships Between Strength, Anthropometrics, and Strongman Performance in Novice Strongman Athletes. Journal of Strength and Conditioning Research, 26(2), 513–522. https://doi.org/10.1519/JSC.0b013e318220db1a
[11] Bland, J. M., & Altman, D. G. (1986). Statistical Methods for Assessing Agreement Between Two Methods of Clinical Measurement. The Lancet, 327(8476), 307–310. https://doi.org/10.1016/S0140-6736(86)90837-8
[12] Koo, T. K., & Li, M. Y. (2016). A Guideline of Selecting and Reporting Intraclass Correlation Coefficients for Reliability Research. Journal of Chiropractic Medicine, 15(2), 155–163. https://doi.org/10.1016/j.jcm.2016.02.012
[13] Soligard, T., Schwellnus, M., Alonso, J. M., et al. (2016). How Much Is Too Much? (Part 1) International Olympic Committee Consensus Statement on Load in Sport and Risk of Injury. British Journal of Sports Medicine, 50(17), 1030–1041. https://doi.org/10.1136/bjsports-2016-096581
More From The Journal
Training
The Science of Strongman Training - Episode X: Competition Programming
How to build a complete Strongman competition preparation block: calendar, events, volume, intensity, specificity, simulations, autoregulation, tapering and fatigue management.
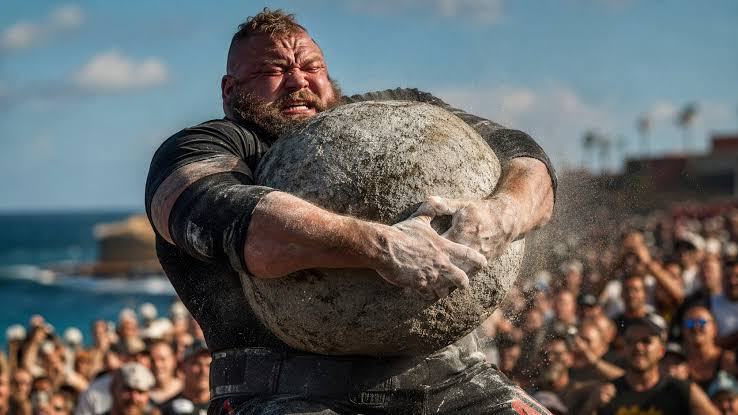
Training
The Science of Strongman Training - Episode IX: Peaking
Peaking in Strongman: how to turn months of training into maximal competition performance by reducing fatigue, preserving adaptations and managing specificity.