
Training Science
Series: STRONGMAN DATA LAB: HOW WE MEASURE AND ANALYSE PERFORMANCE - Episode 3: The Relationship Between 1RM and Dynamic Event Performance
October 15, 2026
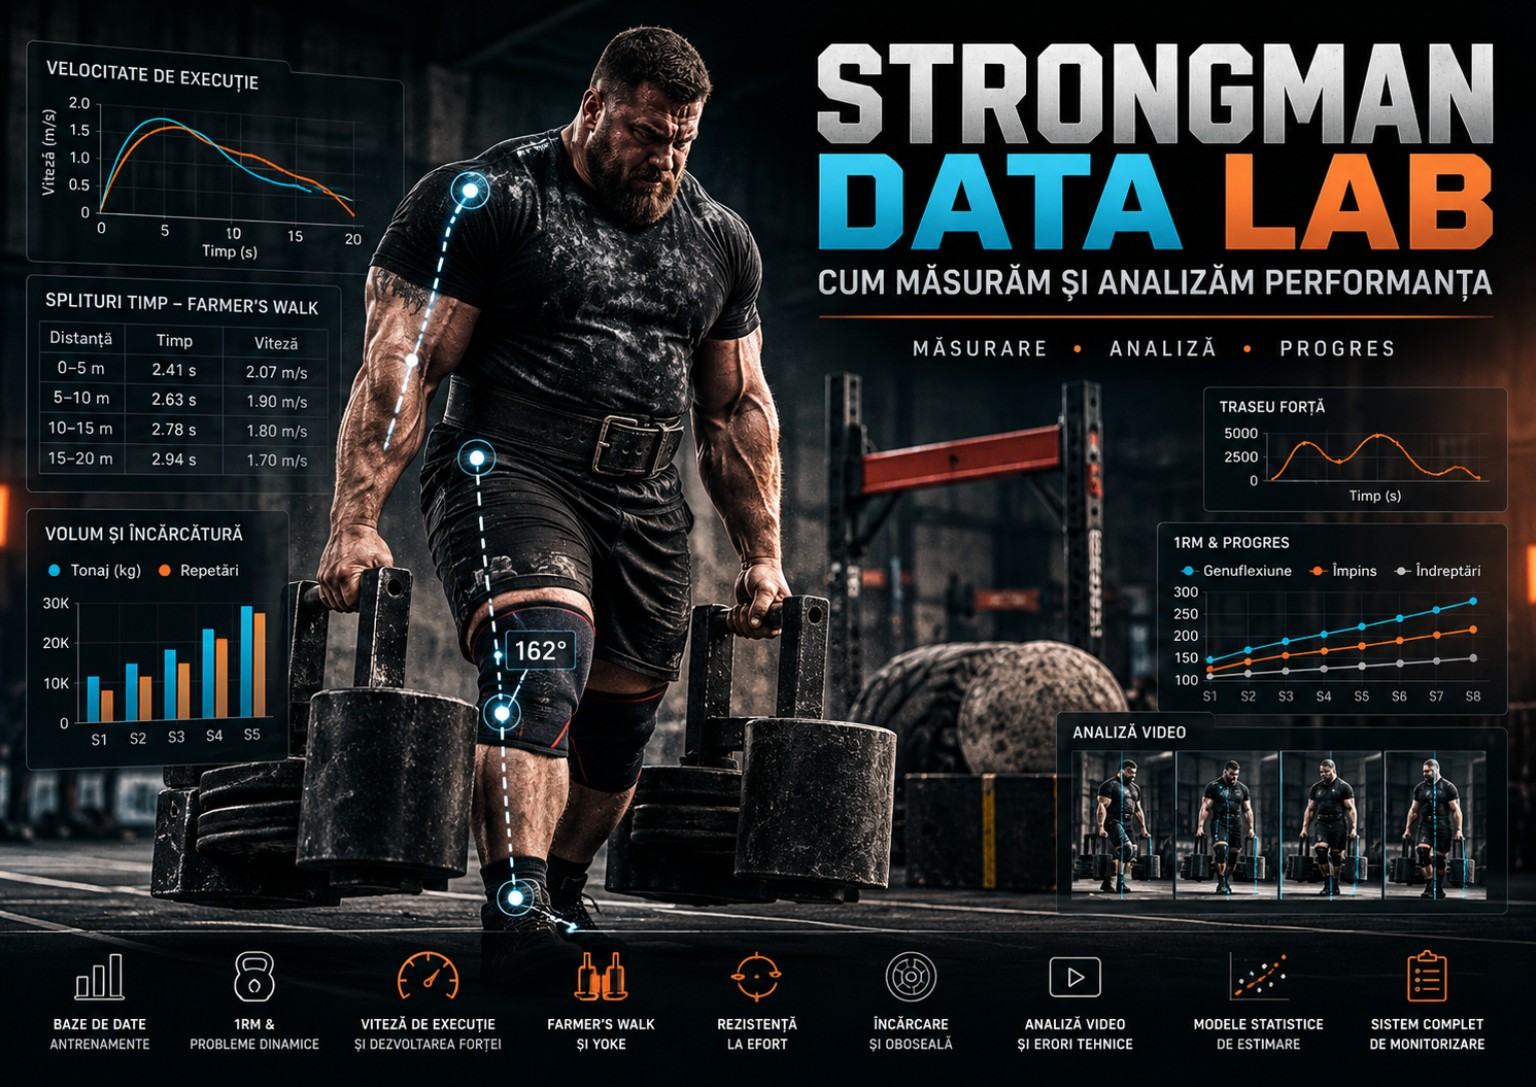
An athlete may Deadlift 300 kilograms yet lose a Farmer’s Walk race to someone with a lower conventional one-repetition maximum. Another may possess an exceptional Squat but lose seconds during Yoke because of pickup technique, frame sway or stride rhythm. In Truck Pull, absolute strength matters, but traction, force direction and vehicle resistance substantially change the task. These situations do not contradict the value of maximal strength. They show that one-repetition maximum and dynamic-event performance are related rather than interchangeable measures.
Episode One of STRONGMAN DATA LAB established valid measurement, comparability and uncertainty. Episode Two developed a database structure that distinguishes loads, times, apparatus and attempts. We can now address a direct coaching question: to what extent does a one-repetition maximum in Squat, Deadlift, Strict Press or Log anticipate performance in Yoke Walk, Farmer’s Walk, Truck Pull and other moving events? The answer cannot be one universal equation. It depends on the event, competitors, loading, testing methods and the statistical meaning of a relationship.
Useful empirical evidence exists. Winwood, Keogh and Harris studied 23 semiprofessional rugby players with extensive resistance-training experience and some strongman familiarity, relating gym-based strength tests to Farmer’s Walk, Truck Pull, Tire Flip and Log performance. They reported squat associations of approximately r = 0.61–0.85 across strongman events and r = 0.87 between a constructed system-force indicator, body mass plus Squat 1RM, and overall performance in their sample [1]. These are meaningful observations, not a personal conversion formula stating how many Farmer’s seconds will be gained from another five kilograms of Squat.
Interpretation demands precision. Participants were not representative of all elite strongman competitors, and the observational design cannot establish what changing one capacity through training would cause. A between-person correlation is not equivalent to the trajectory of one athlete over several years. Dynamic events also differ in weight, distance and equipment. A one-repetition maximum is specific to an exercise performed under particular conditions; it does not directly measure walking speed or horizontal force available through a Truck Pull harness.
This episode develops the connection through biomechanics, statistics and numerical examples. We discuss why Squat may reflect an important resource for loaded movement, how Deadlift relates to Farmer’s pickup, why maximal Log capacity cannot fully explain a timed-repetition event, and how prediction changes with turns or different ground surfaces. Pearson's r, r-squared, partial correlation, prediction error, confounding variables, standardisation and the distinction between group estimates and individual coaching are explained.
All athletes and training histories in illustrative examples are fictional. We will not invent study coefficients or imply that progress in a gym lift guarantees a particular change on the competition course. The accessible scientific approach continues through coherent paragraphs, explained equations and a bibliography. The intended outcome is an analytical method coaches can use with real training logs while recognising exactly what statistical analysis can and cannot establish.
1. What a one-repetition maximum actually represents
One-repetition maximum is the greatest load a competitor can lift once under a specified accepted movement standard. It only has meaning alongside exercise, range of motion, equipment and judging criteria. A floor Deadlift with a standard bar is not identical to Axle Deadlift or Rack Pull. Squats using different depths or supportive equipment also represent different tasks. Maximal strength is therefore evaluated through a specific protocol, not an abstract reserve of force equally available in every movement.
Variations are especially important in strongman. Log involves cleaning and pressing an implement under event rules, whereas straight-bar Strict Press and Push Press differ technically. Records cannot be converted automatically between them. A 280-kilogram conventional Deadlift does not reveal exactly how heavy a Sandbag someone can lift or the largest Yoke that can be carried. Biomechanics, object shape and execution strategy influence observed performance.
Daily maximal capacity depends on fatigue, warm-up, experience, motivation and possible pain. A tested 1RM is therefore an observation at a particular moment. Two tests separated by several days may differ without major structural muscular changes. Progress interpretation needs reliable methods and knowledge of each attempt's circumstances. A competition best can be entirely valid for ranking without representing a pure estimate of muscular adaptation.
Some studies measure 1RM directly, while others estimate it from submaximal sets. These are not interchangeable without checking. Prediction equations depend on exercise, repetition count and athlete characteristics. Entering estimated maxima into regressions as though they were error-free measurements can exaggerate model precision. The database described in Episode Two should preserve measurement method and certainty for every result.
Movement speed is another overlooked point. At 1RM, muscular and neural demands may be very high while implement displacement is slow. Moving events require repeated support and propulsion cycles rather than overcoming resistance once. Maximal strength may supply a resource without fully describing its expression through fast, economical and sustained movement.
Operational definition is the first analytical filter. Comparing 1RM with Farmer’s requires identifying the exact maximal lift and testing conditions; comparing it with Yoke requires a clearly defined dynamic outcome and course. Without these details, calculating Pearson's coefficient generates a number but does not guarantee that it answers the intended sporting question. Useful models begin by deciding which variables can legitimately be compared.
2. Why a moving event involves more than transported mass
Yoke, Farmer’s Walk and Truck Pull are moving events, but their mechanical demands differ. Yoke transfers much loading through the upper trunk and requires control of frame sway. Farmer’s requires sustained grip and balance during locomotion. Truck Pull transfers force through the athlete into a harness or rope while traction and rolling resistance determine much of the external demand. The same Deadlift maximum cannot be expressed identically in all three systems.
Finishing time may be separated into pickup or launch, acceleration, travel, turns and finish. Technical changes can improve time before 1RM changes. An athlete using excessively hesitant opening steps may waste time before reaching useful speed; another may compromise balance through aggressive acceleration. Pacing is a task-specific skill, not merely a consequence of available muscular force.
During Farmer’s, grip can become limiting before hip extensors approach maximal output. During Yoke, trunk control and apparatus sway can limit locomotion even if the athlete could support the load statically. In Truck Pull, slipping footwear prevents effective transfer of available force into the ground. Strength transfer depends on the complete mechanical chain and event characteristics.
Duration changes physiological demands. A very heavy ten-metre Farmer’s may be dominated by pickup and acceleration. Forty metres adds substantial grip maintenance and control under fatigue. A short Truck Pull differs from a minute-long pull. Predicting every outcome from one maximal-lift value ignores fundamental differences in task duration and organisation.
The systematic review by Hindle and colleagues summarises distinct strongman kinematic and loading characteristics [2]. It does not imply that traditional lifts are irrelevant. Instead, predictors must be evaluated against the target event, and conclusions cannot be automatically transferred among tasks. Biomechanical similarity suggests plausible transfer without quantifying its individual causal effect.
A multidimensional profile is therefore more defensible: maximal strength, launch ability, split speed, stability, repeated-effort tolerance and technique. The number of metrics should remain practical, yet reducing everything to 1RM loses important information. In the database, load and completion time remain outcomes, while 1RM serves as a possible explanatory variable. Analysis tests associations rather than assuming the answer in advance.
3. The Winwood study: what twenty-three observations tell us
A directly relevant paper was published by Winwood, Keogh and Harris in the Journal of Strength and Conditioning Research [1]. The authors tested twenty-three semiprofessional rugby players with substantial resistance-training experience and some strongman exposure. Anthropometric measures and maximal Bench Press, Squat, Deadlift and Power Clean were compared with Tire Flip, Log Clean and Press, Truck Pull and Farmer’s Walk results. The design was observational and based on correlations among measured characteristics.
Squat 1RM showed reported relationships with strongman event performance ranging from r = 0.61 to 0.85. These are between-athlete associations, not proof that increasing Squat causes proportional improvements in each event. The constructed system-force index, body mass plus Squat 1RM, was reported to correlate at r = 0.87 with overall strongman performance. It captured two useful characteristics within that sample but did not establish a universal ranking equation.
The meaning of r = 0.87 needs care. It does not state that eighty-seven percent of each athlete's performance is determined by the index. Under suitable assumptions in a simple linear regression, squaring the coefficient gives approximately 0.757, or 75.7% of the observed variation described linearly within the sample. This is neither a causal fraction nor a percentage of an individual's physical capacity. A model fitted to those participants may perform less well with new athletes.
Participant selection limits generalisation. The group comprised young, relatively heavy rugby players, not a balanced representation of elite strongman divisions, female and male competitors or masters athletes. Relationships can change among highly experienced competitors with similar strength and more homogeneous technique. Restricted strength ranges may produce weaker correlations even where strength remains mechanically important. Population differences define the study's limits without invalidating its results.
Body mass may influence force-producing capacity and the demands of some events simultaneously. Correlation with an index including body mass does not prove that gaining body weight automatically improves performance. Effects depend on composition, traction, movement economy and task demands. Turning this observation into a nutrition prescription would go beyond the evidence. The study reports associations under a specific assessment design.
Its contribution remains meaningful: maximal gym strength is associated with several strongman outcomes in a relevant, though limited, population. A future question is whether within-athlete changes in 1RM prospectively predict changes in dynamic events under standardised conditions with other factors considered. Meanwhile, Squat is a useful reference without becoming an athlete's competitive destiny.
4. Pearson correlation: a relationship, not a guarantee
Pearson's r describes the direction and strength of a linear association between two numerical variables, ranging from minus one to plus one. Positive values indicate that higher values of one variable tend to accompany higher values of another; negative values describe an inverse relationship. When dynamic performance is finishing time, greater strength may correlate negatively because stronger athletes take fewer seconds. If the outcome is average speed, the same favourable relation may appear positive. The sign depends on the outcome definition.
Imagine ten athletes performing an identical twenty-metre Farmer’s course at the same load. Calculate correlation between Squat 1RM and finishing time. A hypothetical r = -0.70 would indicate a fairly strong inverse linear relationship in that sample. It does not guarantee that everyone with a higher Squat is faster than every competitor with a lower value. Grip, technique, experience and measurement error can create relevant exceptions.
A coefficient near zero does not prove that strength is unimportant. The relationship may be nonlinear, the range restricted, measurements noisy or other factors dominant. Among elite athletes with closely clustered 1RM values, strength may remain necessary for participation while explaining little of the residual time differences. This is a limitation of the comparison range, not proof that force-producing capacity has no mechanical role.
Outliers can strongly influence Pearson. If most athletes Squat between 220 and 260 kilograms while one lifts 350 and wins decisively, that point may materially affect the coefficient. Scatterplots, error checks and transparent sensitivity analyses are useful. Valid observations should not be deleted merely to improve a relationship. Exceptional performances remain part of sport even when they complicate an attractive model.
A coefficient from one contest describes between-person differences at that time. It does not automatically explain how each competitor will respond to training. Within one athlete, Squat progression and Farmer’s times may both be affected by familiarisation and fatigue management. Longitudinal association demands a different design and interpretation from cross-sectional comparisons.
Data Lab should report r alongside sample size, event definitions, measurement methods and uncertainty. Small samples can produce unstable correlations after adding only one or two athletes. A p-value does not turn association into causation, and statistical non-significance does not establish that a relation is absent. Statistics should support conclusions proportionate to the observations.
5. R-squared, described variance and the error statistics can conceal
In simple linear regression with an intercept, the squared Pearson coefficient equals the coefficient of determination under the relevant calculation. If r is 0.80, r-squared is 0.64. Descriptively, the fitted linear model accounts for roughly 64% of observed outcome variation around its mean in that sample. This does not mean that sixty-four percent of an individual's strength or speed is caused by the predictor. Confusing described statistical variation with causal contribution is a common error.
Prediction error matters more directly to coaches. Two models can have similar r-squared values but different errors expressed in seconds, especially across samples with different variability. When podium places are separated by half a second, a three-second mean absolute error may make a model unsuitable for tactical decisions despite an impressive scatterplot. Accuracy must be judged against the decision.
Consider a purely illustrative model predicting a Farmer’s time of 21.0 seconds when the athlete actually finishes in 24.5. The error is 3.5 seconds. Another athlete finishing in 19.8 against the same prediction has an absolute error of 1.2 seconds. Averaging absolute errors produces MAE, an interpretable performance measure. These are fictional values, used only to demonstrate why correlation does not eliminate uncertainty in individual predictions.
Confidence intervals for estimated mean outcomes differ fundamentally from prediction intervals for new individuals. The latter are usually wider because they incorporate individual deviations around the modelled relationship. A group average at a given Squat level may be estimated reasonably well while predictions for particular competitors remain weak. Individual prediction is often exactly what sport users desire and exactly where uncertainty deserves attention.
R-squared can be overly optimistic in the sample used to construct a model, especially when many variable combinations are tried and only the most favourable retained. Separate evaluation data, suitable cross-validation and transparency about model exploration can reduce this optimism. Complex algorithms do not automatically solve small-sample problems. A simple model with visible limitations may be more honest.
A responsible Data Lab model should report event definition, sample size, assessed predictor range, error on data not used for fitting and extrapolation warnings. Without these, a chart remains exploratory at best, not a rule for selecting competition attempts or maximal training loads. Predictions without communicated error transform uncertainty into an appearance of certainty.
6. Squat and Yoke: biomechanically plausible, not identical
Yoke requires supporting enormous load through the upper body while propelling the system forward. Squat trains lower-limb extension and trunk stability under load, making transfer plausible. But Yoke is not simply a moving Squat. Joint ranges, alternating single-leg support and control of apparatus sway change demands. A strong Squat can increase available resources without ensuring efficient walking technique.
Winwood and colleagues identified Squat associations with several strongman events [1]. However, the reported test battery did not include Yoke as one of those event outcomes, so their study should not be cited as providing a direct Squat–Yoke correlation. Specific Yoke mechanics are better addressed using research such as Hindle and colleagues' 2021 analysis [3]. Different sources answer different questions: some describe general strength relationships, others what occurs during loaded walking.
The 2021 Yoke study included nineteen strongman athletes, twelve men and seven women, completing twenty-metre runs at approximately 85% of a protocol-defined maximal Yoke load. Researchers examined five-metre intervals and reported changes in velocity, stride length and rate, and stance duration [3]. These are movement characteristics within a specific protocol, not conversion coefficients turning Squat kilograms into Yoke seconds.
A very strong athlete may be limited by slow pickup, poorly adjusted bar height or lateral oscillation. A competitor with a slightly lower Squat may accelerate sooner and spend less time correcting balance. Looking only at 1RM might favour the former, while the complete task determines the winner. General strength development and Yoke-specific practice can therefore serve complementary purposes.
Analysis might consider Squat 1RM alongside body mass, start time and Yoke splits. Predictor count must be appropriate for sample size to avoid overfitting. Within an individual log, comparing standardised Yoke tests before and after Squat development may be informative without proving causation. Changes could arise from strength and technical familiarisation together.
The practical recommendation is neither to abandon Squat nor to replace specific Yoke practice with Squat alone. Identify whether the constraint is load support, the first steps, speed or stability, then choose relevant interventions. Additional 1RM capacity matters when it creates useful reserve; the actual transfer test remains a comparable carry.
7. Deadlift and Farmer’s Walk: pickup is not the complete race
Farmer’s often begins with a difficult handle pickup. Hip extension, trunk control and overcoming load share features with Deadlift. A high Deadlift maximum is therefore a plausible resource, especially under heavy per-hand loading. Once the implements leave the ground, however, the task becomes locomotion with suspended lateral loads, strong grip demands and balance challenges. A single maximal pull does not characterise that second phase.
Winwood and colleagues biomechanically compared Farmer’s Walk, Deadlift and unloaded walking in six experienced strongman athletes [4]. Joint positions, forces and stride characteristics differed. The findings indicate overlap without mechanical equivalence. The small sample does not permit universal claims about the relationship between Deadlift records and Farmer’s times. The paper examines movement rather than producing an individual prediction equation.
Consider two fictional competitors. Athlete A Deadlifts 300 kilograms and picks up Farmer’s handles quickly but loses grip after fifteen metres. Athlete B Deadlifts 270, picks up slightly more slowly and completes the course without a drop. B may win despite A's higher maximal pull. Deadlift remains relevant, but the moving task is constrained by more than initial floor-to-standing force production.
Useful analysis separates pickup, the first five metres, middle sections, final section and drops. When most time is lost during pickup, extension strength and initial mechanics may deserve attention. When pickup is fast but implements are dropped near the finish, grip tolerance and pacing are more obvious questions. Stopwatch data alone cannot diagnose causes, requiring video and technical observations.
Deadlift variant matters. Elevated Rack Pulls may train parts of the movement, but do not provide conventional 1RM through any universal conversion. Axle diameter, straps and raised starting positions modify mechanics and grip demands. When Deadlift is used as a Farmer’s predictor, test definition and whether the maximum is observed or estimated must remain available.
The useful framework treats Deadlift as an indicator of general capacity and Farmer’s as an integrated task. Increased maximal pulling strength may contribute to better carries, but the effect must be observed rather than promised. No validated universal formula guarantees that ten additional Deadlift kilograms subtract a particular number of Farmer’s seconds.
8. Truck Pull: muscular capacity and external resistance are different
Truck Pull clearly separates gym-based maximal capacity from force transmitted into a real system. A ten-tonne vehicle does not automatically require ten tonnes of pulling force to move. Rolling resistance, tyres, surface, slope, mechanical losses and acceleration determine the external demand. Vehicle tonnage without these conditions is insufficient for rigorous comparison between contests. Power also cannot be derived directly from vehicle mass and finishing time.
Force transfers through a harness or rope, while footwear traction limits how much propulsion can be applied to the ground. Slipping means available muscular capacity is not converted effectively into forward movement. Body position and direction of force also change during the pull. Squat maximum may reflect relevant leg-extensor capacity, but technique, body mass and grip with the surface alter actual performance.
Winwood and colleagues included Truck Pull among the strongman tests compared with gym strength [1]. Their general findings support meaningful relationships in the sampled population. However, it would be inappropriate to invent an event-specific Squat–Truck Pull coefficient without accurately extracting that value from the original study. Confirmed results should remain separate from plausible biomechanical hypotheses that have not been tested here.
In a hypothetical comparison, A has a larger Squat than B but B finishes faster on a course with good traction because of more efficient positioning. On another surface the ranking might reverse. The illustration shows dependence on technique and ground conditions without claiming either is the sole cause. Meaningful comparison requires the same vehicle, tyre conditions, distance and judging rules.
Advanced measurement might include rope tension, vehicle velocity and their temporal profiles. Without appropriate sensors, course timing and video remain useful descriptive outcomes, not direct measurements of instantaneous force or mechanical power. A simplified kilogram-by-metre index should be labelled as a bookkeeping quantity rather than valid mechanical work.
Truck Pull preparation can combine general force capacity with safe familiarisation with event-specific demands. Maximal tests on slippery ground are not justified to validate a model. Progress should be monitored through comparable trials and technical observation, with 1RM remaining one contextual variable rather than the sole predictor.
9. Log Lift repetition events: how far does a 1RM transfer into one minute?
In Log for repetitions, maximal strength affects how demanding the event load is relative to capacity. A 100-kilogram Log represents roughly 77% of a 130-kilogram 1RM but about 91% of a 110-kilogram maximum. The difference suggests a larger relative strength reserve for the first athlete under otherwise comparable conditions. Yet total repetitions in one minute depend on several factors, and relative intensity alone cannot reliably predict the result.
Log Clean and Press contains separate phases: pickup, rotation into position, overhead propulsion and final stabilisation. Someone may have an excellent straight-bar Push Press but lose time cleaning the Log. Another with a lower maximal Log may complete each cycle faster through efficient technique. Repetition count alone does not reveal the limitation. Individual cycle timing and video can add useful context.
Interpretation requires load, time limit, lockout rules and whether each repetition starts from the ground. Returning the Log to the chest differs from repeating a complete clean. Load as a proportion of 1RM can be calculated, but does not correct these rule differences. Uncertainty also grows when 1RM is estimated from another exercise. A directly tested maximal Log and a value extrapolated from straight-bar Push Press are not equivalent.
A hypothetical model might track Log 1RM, average cycle time and pacing decline in the final thirty seconds. High 1RM combined with many rejected repetitions may signal technique or judging-standard issues rather than inadequate maximal force. Stable pacing with inability to move the opening load suggests another problem. Phase-specific observations are needed before choosing training priorities.
Repetition count should not be deduced from a generic 1RM equation. Classic load–repetition relationships were developed using more standardised exercises, while Log adds distinct technical and metabolic demands. Applying such equations without validation produces false precision. Technique can improve without a higher maximum, and maximum strength can increase without proportional changes in repetition tolerance.
Data Lab will preserve 1RM as a possible predictor while recording actual repetition results, rejected attempts, load and time limits separately. Models may be explored on comparable data, but identifying the limiting factor remains necessary before choosing additional volume, technical work or maximal strength training. A higher maximum creates options rather than guarantees.
10. Necessary capacity versus sufficient capacity
Performance analysis distinguishes necessary and sufficient conditions. Moving a very heavy Yoke requires the ability to support and propel its load. Below some task-specific capacity, even excellent technique cannot fully compensate. Exceeding that capacity does not guarantee a fast run because stability, stride rhythm, traction and work tolerance still matter. Strength can therefore be essential without explaining the entire ranking.
This matters as loading changes. At a relatively light task for all participants, maximal strength differences may be less important than speed and coordination. Near individual capacity limits, strength reserve may become more influential. But the relationship is not automatically linear. Technique may change dramatically, or grip may fail before the threshold predicted by a simplistic model.
Plotting Farmer’s time against 1RM might reveal a region in which weaker athletes cannot finish, followed by wide performance differences among those strong enough. That could reflect a threshold and unequal variation rather than one straight line. Models should follow evidence, and testing nonlinearity requires enough observations. Universal numerical thresholds should not be invented without supporting studies.
The practical question becomes whether maximal strength is currently the limiting link. If an athlete cannot pick up the handles, pickup capacity and related technique deserve attention. If pickup is effortless but turns are unstable, more Deadlift may not be the main answer. When load support is stable but completion is slow, split speed and pacing deserve investigation. Each pattern requires a different intervention.
An athlete with a high 1RM may perform modestly in a new event because of limited familiarity. Several sessions can improve results rapidly without a meaningful change in maximal lifting. Technical learning thereby modifies the apparent strength–performance relationship. Novice and experienced groups may show different patterns, with distinct interpretation limits.
The goal is not to debate whether strength matters in absolute terms. It is to establish when, how much and through which mechanisms strength contributes to the particular event and athlete. Several links connect necessary capacity with final performance. Valid analysis recognises them even when only a subset can be measured.
11. Absolute strength, relative strength and body mass
Absolute strength and strength relative to body mass answer different questions. A 140-kilogram athlete may Squat 250 kilograms, while a 100-kilogram competitor Squats 220. The first is absolutely stronger in that lift; the second has a higher simple one-repetition-maximum-to-body-mass ratio. Neither figure determines who wins a 350-kilogram Yoke race. External load is equal while geometry, skill and movement economy differ.
The simple 1RM/body-mass ratio is not a universally correct scaling method. Strength and body dimensions need not relate linearly, and direct division can favour particular divisions. Allometric models offer alternatives, but their exponents require justification for the population. Formulas imported from other sports cannot be declared universal strongman standards. The goal and method of normalisation must be defined before comparison.
Body mass can contribute to traction during Truck Pull, without generating identical benefits on every surface. Heavier athletes may benefit in some conditions and face movement challenges in others. In Farmer’s, body mass interacts with external load and technique. A group association does not establish that changing weight will produce a predictable improvement. Composition, health and event demands matter.
Regressions including Squat 1RM and body mass should examine associations between the predictors themselves. Heavier competitors may also have larger lifts, generating collinearity and unstable coefficients in small samples. Models should be tested on new observations. For an individual, tracking weight, strength and standardised race times together is useful without assigning automatic causal explanations.
Indicator choice depends on the goal. Open competition rewards raw outcomes under its rules; cross-division analysis may investigate scaling; off-season coaching often benefits more from individual history. No one formula correctly covers Log, Yoke, Farmer’s and Truck Pull. Numbers help only when they answer an actual sporting question.
Data Lab treats body mass as context and a possible predictor, not as an automatic prescription to gain or lose weight. Keep raw values, calculations and definitions available. When differences appear, inspect conditions and event structure before proposing mechanical explanations.
12. Event load as a percentage of 1RM
An intuitive index divides the event load by a conventional gym 1RM. If a Yoke weighs 360 kilograms and Squat 1RM is 240, the ratio is 1.5 or 150%. However, Yoke and Squat are different tasks. The ratio does not prove an athlete is carrying 150% of their Yoke-specific maximum. It describes two masses from different exercises, and predictive usefulness needs testing.
Farmer’s total handle mass can similarly be divided by Deadlift 1RM, but geometry and grip demands differ. Using per-hand rather than total mass halves the ratio, highlighting the importance of clear conventions. Analysts can explore these indices as predictors without calling them relative intensity unless the interpretation is justified.
Contest Log load as a fraction of Log 1RM is more closely matched to the exercise, yet still cannot predict exact repetitions per minute. Events requiring a complete clean for each repetition differ from those returning only to the chest. Pace, technique and work tolerance vary individually. Eighty percent of 1RM does not imply a fixed repetition count.
Hindle and colleagues' Yoke study used an event-specific maximum: the largest load carried twenty metres in under twenty seconds without dropping, according to the research protocol [3]. Biomechanical testing then used approximately 85% of that event-specific maximum, not Squat 1RM. Such a Yoke maximum is defined by distance and time, conceptually different from a barbell single.
Database fields should distinguish squat_1rm_kg, deadlift_1rm_kg and protocol-specific Yoke maxima. Extending a Yoke time limit from twenty to thirty seconds may increase the maximal completed load without increased muscular capacity. That changes the test definition and must be recorded as such.
Ratios are justified only when they add useful information beyond raw loads. Athletes still need to pick up, accelerate and control the apparatus. Percentages are hypotheses, not substitutes for safe progression and event-specific assessment. New observations should establish whether a proposed ratio improves prediction.
13. Anthropometry, proportions and event specificity
Height, segment lengths, circumferences and body composition may change strongman mechanics. Arm length can affect Deadlift range, while Yoke dimensions influence posture. Farmer’s handles, Log diameter and Atlas platform height interact with body geometry. Omitting all anthropometric differences may weaken performance models. Yet none of these features predetermines individual potential.
Winwood, Keogh and Harris examined body circumferences and other characteristics alongside gym strength and strongman outcomes [1]. Certain circumferences were associated with overall performance. Those observations do not establish that increasing arm girth causes faster Farmer’s results. Anthropometric measures contain combinations of tissues, while between-person correlation cannot reveal one intervention's causal effect.
Tall competitors may benefit in some platform-loading tasks while struggling with low handle pickups. During Truck Pull, segment lengths and harness positioning can alter force direction. These are context-dependent relationships rather than universal rules. Athletes adapt technique and equipment where rules permit. Body dimensions inform coaching without determining destiny.
Body composition also requires care. Rapid body-weight change is not synonymous with hypertrophy, and fat-free-mass estimates contain method-specific error. Studying weight and Yoke change demands repeated measurements alongside technique, training and fatigue information. Two weigh-ins cannot explain the cause of a race-time difference.
Multivariable modelling tempts analysts to enter height, weight, circumferences, limb lengths and multiple maximal lifts simultaneously. Small samples produce unstable coefficients and weak independent interpretations. Predictors should follow biomechanical hypotheses and available observations rather than spreadsheet capacity. A simpler model may generalise better.
For individual coaching, anthropometry is mostly context. Adjust Yoke height, implement setup and technique to the real competitor. There is no magic body measurement. Well-designed databases prevent unfair comparisons while preserving details that actually change the task.
14. Grip and stability: constraints hidden by Deadlift records
Farmer’s requires both picking up implements and holding them throughout travel. Strapped Deadlift can remove some grip constraints, whereas Farmer’s may require direct hand contact. A huge Deadlift record therefore does not guarantee grip endurance under oscillating loads. Repeated handle drops deserve investigation through the actual event rather than only another maximal pulling test.
Hand dynamometry assesses a specific squeezing task but does not perfectly reproduce heavy, thick, moving handles. Geometry, surface, perspiration and gait affect contact. High dynamometer values can coexist with modest carries. That does not make the test worthless; its validity must be established for the coaching question.
Imagine two athletes both Deadlifting 280 kilograms and performing Farmer’s with 120 kilograms per hand. One completes twenty metres in nineteen seconds without drops; the other needs twenty-seven seconds after two stops. These fictional outcomes show that identical gym maxima can accompany different moving-event performances. Grip, trunk control, skill or ground conditions could contribute, and the total time alone cannot identify the mechanism.
Logs can record time to first drop, number of drops and uninterrupted distance at a defined load. These observations may distinguish pickup limitations from sustained-grip demands. They are not direct measurements of finger force in newtons. Such force estimates require suitable instruments and defined procedures.
Yoke presents another limitation through apparatus sway and repeated trunk corrections. An athlete may support a load statically but lose rhythm during acceleration. Stability is task-specific rather than a number automatically derived from Squat 1RM. Video and splits can guide investigation without providing comprehensive biomechanical or medical diagnosis.
General predictors should therefore sit beside event-specific measurements. Easy pickup followed by late drops raises different questions from inability to lift the handles initially. Those distinctions disappear in a table containing only Deadlift 1RM and final time.
15. Initial acceleration and split speed
The opening seconds of Yoke or Farmer’s combine setup, pickup, balance and initial steps. Higher Squat or Deadlift 1RM can support pickup capacity without guaranteeing efficient transition to locomotion. Hesitation, setup or excessive sway can slow the start. Aggressive acceleration may also lead to corrective movements. Phase analysis is necessary to distinguish these possibilities.
Hindle and colleagues examined five-metre Yoke intervals and variables including stride rate, length and stance duration [3]. Movement parameters changed across the course and with speed. Their findings do not define a universal ideal cadence or mean that every competitor should copy the sample average. Load, experience and anatomy still matter.
Practical testing can record pickup duration, the first five metres and subsequent sections. Improving the start without a higher 1RM demonstrates that factors beyond gym maximum influence performance. The precise cause may remain uncertain, requiring video and repeated comparison. Improved initial speed can also be offset by greater slowdown later.
Average speed is distance divided by time, not a moment-by-moment acceleration profile. Two eighteen-second runs may have markedly different pacing. One starts fast and fades, another starts slowly and finishes strongly. Training priorities can differ. Squat 1RM might explain some overall variation without revealing this internal distribution.
Video acceleration estimates need temporal and spatial calibration. Position-tracking noise is amplified by mathematical differentiation, producing artificial peaks. Attractive curves are not necessarily valid measurements. Repeatable split times may be more useful than false precision. Interpreting splits as neural capacity or horizontal force requires additional evidence.
Monitoring should identify where time is lost. Pickup issues invite one response, middle-course instability another, and late decline another. Changes must be verified under comparable loads and routes. One-repetition maximum is part of the explanation rather than the whole explanation.
16. Training specificity: association is not automatic transfer
Training specificity reflects the movements, loads, velocities and effort characteristics being practised. Squat and Deadlift can develop useful general capacities, while Yoke and Farmer’s refine event-specific demands. This does not make general exercises inferior or imply that strongman athletes should train only with contest implements. Effective programmes may combine complementary adaptations according to phase and individual needs.
Positive transfer occurs when an adaptation can be expressed in another task. Stronger leg extension may support Yoke pickup, but total race improvement depends on how the capacity is used. Poor carrying technique can limit the benefit from a larger Squat. Establishing the contribution requires before-and-after testing and appropriate consideration of other changes.
Hindle and colleagues' review discusses biomechanical similarities and differences between strongman and traditional exercises [2]. Such evidence can inform exercise selection, but similar movement patterns do not by themselves prove performance transfer from a programme. Biomechanical studies describe forces and movement, whereas causal training effects require suitable intervention designs.
During off-season, hypertrophy and general strength may justify greater emphasis on Squat and Deadlift volume instead of frequent maximal event simulations. As competition approaches, apparatus, load and distance specificity often become more relevant. This is a framework rather than a universal calendar. Athlete history, injuries and recovery capacity shape implementation.
Imagine an athlete adding twenty kilograms to Squat and improving Yoke by two seconds during a cycle that also includes event-specific practice. Both improvements can be described. Claiming that the Squat increase caused the entire time gain is unwarranted. Familiarisation, technique and fatigue changes remain plausible contributors.
Identifying the limiting link matters more than arguing over general versus specific strength. Someone barely picking up Yoke differs from someone carrying it smoothly but slowly. Data should show which aspect changes after an intervention. Maximal lifting becomes a reference for training decisions rather than a target that crowds out everything else.
17. Maximal strength and movement speed: the load–velocity relationship
In resistance exercise, execution speed generally varies with load. Under defined protocols, heavier loads move more slowly, although the exact relationship depends on individual and exercise. Velocity-based training literature explores using speed for monitoring and estimates of maximal capacity [6]. These methods can be useful without justifying automatic transfer of equations developed for Bench Press to Log, Yoke or Farmer’s.
Bar speed in a concentric repetition and an athlete's horizontal carrying speed describe different movements. A transducer measuring Squat-bar travel does not directly reveal Yoke locomotion speed. Even though both are expressed in metres per second, direction, range and task differ. Shared units do not establish mechanical equivalence or predictive validity.
An athlete may increase Squat speed at a fixed load without immediate Farmer’s improvement because grip or technique remains limiting. Conversely, handle familiarisation may improve Farmer’s without changing Squat speed. Gym load–velocity data can describe capacity in that exercise while transfer to moving events still requires verification.
Estimating 1RM from velocity entails errors that depend on exercise, device and model. Extrapolation from light loads to maximal effort can be uncertain. Minimum velocity associated with 1RM is not universally identical across exercises or people. Databases should distinguish actually completed maxima from estimated values and preserve method details.
Monitoring can begin with repeatable submaximal loads using consistent equipment. Where sensors have not been validated, outputs should be treated as exploratory. A graph should not dictate hazardous maximal attempts without known error. Apparent precision does not justify extra risk merely to confirm a prediction.
Load–velocity profiles may add useful information about strength but cannot replace event-specific testing. Yoke also requires course speed; Farmer’s needs pickup, pace and drop observations. Estimated 1RM can contribute context, while dynamic outcomes need their own real measurements.
18. How the relationship changes under very heavy loads
Dynamic-event performance can relate differently to maximal strength under moderate versus near-limit loads. At 80 kilograms per hand, a strong competitor's Farmer’s result may depend primarily on walking speed and technique. At 150 kilograms per hand, pickup and grip support may dominate. The changing constraint can modify the statistical relationship between Deadlift 1RM and finishing time. No universal numerical threshold should be invented.
Yoke allowing rapid acceleration differs from loading that demands cautious steps and greater sway control. With results at several masses on the same course, an individual time–load profile can be created. Time may rise disproportionately near heavy loads, but such profiles are individual. Extrapolating toward untested weights is uncertain and may encourage unsafe expectations.
Statistical models can include interaction between 1RM and event load, allowing the apparent role of maximal strength to depend on loading. Such models require substantially more information than a few trials. Four runs across two weights cannot support many regression parameters. Descriptive charts can be more defensible than elaborate equations fitted to sparse data.
Experience also matters. Novices may improve rapidly through learning, changing strength–time relationships across months. Experienced athletes may have more stable technique while small differences in load and fatigue become important. These are plausible mechanisms requiring longitudinal strongman studies to quantify; we should not assign invented category-specific coefficients.
Near maximal loads, frequent testing can create large fatigue costs. Increasing weight until failure solely to complete a graph is not justified. Safe submaximal trials and periodic assessments may offer useful information while maintaining clear prediction limits. Athlete preparation takes priority over satisfying a statistical model.
Transfer is not one fixed coefficient. The relationship between 1RM and dynamic outcomes can change with load, duration, skill and population. Competition predictions need assessment under comparable conditions. A successful moderate-load test cannot guarantee behaviour with extreme apparatus mass.
19. Between-athlete comparisons versus change within one athlete
Group correlations ask whether athletes with higher predictor values tend to have different outcomes from their peers. They do not automatically reveal what happens when one athlete increases 1RM. Competitors with stronger Squats may also have practised Yoke for longer, making strength and experience overlap. A high coefficient can partly reflect sample selection rather than the isolated effect of strengthening the squat.
Longitudinal analysis follows the same athlete over time. If Squat rises from 220 to 240 kilograms while Yoke time falls from twenty-one to nineteen seconds, the changes are compatible with positive transfer without proving causation. Event-specific practice, sleep and frame familiarity may improve simultaneously. Those changes must be documented before assigning the entire two seconds to one exercise.
Average group change also differs from individual response. A programme can raise maximal strength on average without producing identical gains in moving events for everyone. For coaching, the range of responses and uncertainty may matter more than the mean. One success story does not prove universal programme superiority, while a modest responder does not invalidate its usefulness for others.
Repeated observations within one athlete are often correlated through time. Today's performance resembles last week's, and repeated tests are not independent participants. Treating each training entry as a new athlete in an ordinary regression exaggerates certainty. Multi-athlete studies may require models accounting for athlete clustering and chronology. Individual logs can still show useful trends without pretending to be controlled experiments.
Comparable testing before and after a cycle helps when apparatus, load and conditions match. Intermediate assessments may indicate gradual change or improvement after reduced fatigue. Frequent maximal attempts are not justified simply to create a smooth graph. Testing should protect preparation. Missing observations also need context, especially when injury or inability to complete an event explains their absence.
Data Lab separates between-person findings from individual progression. One informs associations within a group; the other describes a person's changing history. Both are valuable, yet neither alone can assign progress with certainty to one variable. Maintaining this distinction is essential to responsible interpretation.
20. Confounders and partial correlations
A confounder is related to both predictor and outcome and can alter interpretation. In strongman, experience, body mass, division, apparatus familiarity and overall training may influence both 1RM and Farmer’s time. If more experienced athletes lift more and carry faster, raw Deadlift–time correlation may partly reflect experience rather than strength alone.
Partial correlation describes an association after statistical adjustment for one or more additional variables under model assumptions. One could explore Squat–Yoke association after accounting for body mass. This does not create an experiment or eliminate unknown confounders. Measurement error and omitted experience remain relevant.
Adjustment can even create bias when the wrong variables are controlled. Some characteristics lie on the pathway connecting exposure and outcome, so removing their contribution changes the question. Others can be consequences of unmeasured factors. Before regression, develop a plausible causal account of each variable rather than inserting every spreadsheet column.
Imagine athletes with higher Squats also perform faster Farmer’s. Suppose they all train with familiar handles while weaker competitors are encountering the implement for the first time. Familiarisation may contribute to the association. Adding a gym label cannot entirely solve an unfair testing design. Comparable procedures often prevent confounding more effectively than later calculations.
Small samples make multi-variable adjustment unstable. A model with ten athletes and eight predictors provides a weak basis for independent coefficient interpretation and future prediction. Descriptive charts with a few carefully chosen hypotheses may be better. Statistical complexity cannot repair sparse or incomparable observations.
Coaches can ask what changed alongside the record: experience, specific training, mass, sleep or course conditions? Clear answers make transfer assessments more defensible. Adjusted correlations may contribute information, but do not replace good testing and contextual observation.
21. Collinearity: when predictors carry overlapping information
A model including Squat 1RM, Deadlift 1RM, estimated muscle mass and body mass may look comprehensive. Yet these variables often correlate with each other: larger competitors may have stronger results across lifts. Overlapping predictors make independent coefficient estimation unstable, with small sample changes shifting signs or magnitudes. Prediction may remain possible, but assigning mechanical meaning to every regression slope becomes risky.
Imagine twelve athletes whose Squat and Deadlift rankings almost coincide. Including both in regression can make software assign most of the variation to one and little to the other. It would be incorrect to conclude that the second movement has no biomechanical importance. The dataset may simply lack information needed to separate their roles.
Variance inflation factors and related methods can help identify collinearity without providing universal magical thresholds. The central question is why predictors were included and whether they add distinct information. In small strongman samples, one representative strength metric may be more stable than entering every gym record. Choice should reflect a prespecified question.
Winwood's system-force index deliberately combined body mass and Squat 1RM [1]. That construction can be descriptively useful without revealing independent causal contributions from its components. Further analysis would be required to separate them. Summing two numbers does not guarantee the best predictor for all populations.
For prediction, compare simple Squat-only or Deadlift-only models with a combined model using evaluation data excluded from fitting. If extra variables do not reduce new-data error, complexity may be unnecessary. If accuracy improves consistently, additional predictors can be retained without automatically receiving causal interpretations.
More similar numbers do not necessarily create more knowledge. Monitoring both Squat and Deadlift may help programming, but using correlated values together in a model calls for care. Simplicity can improve interpretability and stability.
22. Sample selection and the problem of highly skilled competitors
Correlations in a heterogeneous group may exceed those in a restricted elite sample. Competitors with Squats ranging from 100 to 300 kilograms provide substantial predictor variation. In a final where nearly everyone Squats 250–290, remaining Yoke differences may be dominated by technique or tactics. Lower correlation there does not establish that strength is irrelevant; restriction of range and selection can explain part of the pattern.
Selection also operates through completion. Analysing only athletes who finished Farmer’s excludes those unable to pick up or maintain the load. The model then describes performance conditional on passing a completion threshold. Predicting the chance of finishing requires retaining failed attempts with a distinct status. An abandoned race is neither zero seconds nor a harmless missing observation.
Competition tactics complicate sampling. Athletes sometimes stop once enough points are earned, so repetition totals need not represent maximal available capacity. A very strong competitor may appear modest because additional work was unnecessary. Recording known stopping reasons reduces misinterpretation. Statistical correction should not precede understanding the sporting decision.
Small samples generate unstable associations. One unusually strong and fast athlete can materially affect correlation among ten participants. Sensitivity analyses should be transparent, not used to select flattering estimates. Scatterplots showing individual observations and uncertainty intervals can communicate more than one headline coefficient.
Sex and division differences should not be reduced to stereotypes or one assumed universal model. The 2021 Yoke study included men and women, but nineteen participants under one protocol cannot establish every individual difference [3]. Larger strongwoman and masters datasets would help. Until then, recommendations should be individualised and uncertainty acknowledged.
Models developed in small semiprofessional samples cannot automatically become standards for international championships. Competitive level, apparatus and context differ. External validation is not an academic decoration: it protects practical decisions from predictions used outside their evidential domain.
23. A numerical example: identical strength, different dynamic outcomes
Consider a fictional dataset of four athletes attempting an identical twenty-metre Farmer’s Walk at 120 kilograms per hand. Athlete A Deadlifts 260 kilograms and finishes in twenty seconds; B Deadlifts 280 and finishes in nineteen; C also Deadlifts 280 but takes twenty-five seconds; D Deadlifts 300 and finishes in eighteen. These are educational values rather than research observations or real competition results. A broad tendency may favour stronger Deadlifts, but C is an important exception.
Removing C would probably make the association between Deadlift and time appear tighter. Yet C may represent precisely the phenomenon worth investigating: adequate maximal pulling capacity combined with grip failure, an implement drop or poor technique. Deleting the observation without cause would conceal relevant event variation. The database should instead include drops, pickup time and video observations where available.
Transforming time into average speed changes the direction of favourable results. Twenty metres in twenty seconds equals 1.0 m/s; nineteen seconds is approximately 1.053; twenty-five seconds is 0.8; eighteen seconds is approximately 1.111. Correlation with Deadlift might therefore change sign because better values are now larger rather than smaller. Transforming the outcome does not eliminate individual variability or supply a physiological explanation.
Even a useful linear model cannot imply that twenty additional Deadlift kilograms produce the same time gain for each athlete. Here B and C possess identical Deadlift maxima while their times differ by six seconds. This does not contradict statistics; it shows that one predictor cannot describe every source of variation. Coaching decisions should focus partly on these residual differences rather than treat them as inconvenient noise.
Adding a second event, perhaps Yoke at 320 kilograms, could produce a different ranking from Farmer’s. That would reveal task specificity rather than prove general strength irrelevant. We should not calculate a coefficient from four observations and present it as a population standard. Such small fictional datasets clarify concepts without supporting robust prediction equations.
The example shows why databases preserve events and attempts separately. A table containing only Deadlift 1RM and average points across two events would conceal the athlete-specific limitation. A useful conclusion is that C deserves further investigation during Farmer’s. The numbers alone cannot establish which muscle caused the slowdown or how many weeks would solve it.
24. Measurement error can create or conceal apparent relationships
Correlation cannot be more reliable than the measurements entering it. Different Deadlift judging standards and inaccurately measured Farmer’s courses can distort associations. Random measurement error may attenuate relationships, while group-linked systematic error can produce misleading ones. Standardisation is therefore not bureaucracy; it establishes whether numerical columns describe comparable phenomena.
Imagine one gym starting Farmer’s timing at the signal and another when handles leave the floor. The first protocol includes an additional phase. If stronger Squat athletes happen to come from that gym, the raw strength–time correlation may be distorted. Increasing sample size alone cannot repair incompatible timing. Protocols need harmonisation or explicit modelling.
Implement weights are sometimes reported approximately. A 360-kilogram Yoke label may mean frame plus plates or plates alone, while Farmer’s could be reported per hand or in total. Recording these ambiguously can artificially alter event-load-to-1RM ratios. Any analysis using percentages must be able to reconstruct the actual mass and unit conventions.
Failed attempts create another complication. If an athlete stops before twenty metres, elapsed time is not a twenty-metre completion time. Keeping status and completed distance separately is better than inventing a finishing value. Excluding every failure makes the analysis conditional on completing the task. Both practices can materially change estimated associations.
Reliability can be examined through comparable submaximal testing without requiring constant maximal exertion. Sports-measurement research emphasises distinguishing noise from meaningful change [7,8]. There is no universal error threshold for Yoke or Farmer’s regardless of method. A difference of two-tenths may be meaningful or merely noise depending on timing quality.
Reports should therefore describe methods, sources and uncertainty where available. Additional decimal places must not conceal modest accuracy. When records use incompatible protocols, separate analyses may be more appropriate than one regression. Sometimes the strongest valid conclusion is that the dataset does not yet support comparison.
25. Building a simple regression without confusing the data
Analysis can begin with one predictor, such as Squat 1RM in kilograms, and one outcome, such as time for a 300-kilogram Yoke over twenty metres. Every athlete needs a sufficiently comparable protocol. A simple regression can be written as estimated time = intercept + slope × Squat 1RM. The slope describes average association per additional kilogram within the fitted relationship, not automatically the causal effect of Squat training.
Before fitting, inspect a scatterplot, units, missing observations and unusual values. Check whether the relationship is approximately linear or whether weaker athletes fail to finish, making completion an additional outcome. Regression among finishers does not automatically describe the probability of finishing. Failure information should remain available rather than disappear through data cleaning.
A fictional equation might read estimated time = 38 − 0.06 × Squat 1RM. At 250 kilograms, the prediction would be twenty-three seconds. This is an educational formula, not a validated prediction rule. Its slope is not a universal biological effect. Extrapolating to a 500-kilogram Squat produces an implausible result, demonstrating why fitted equations cannot be applied arbitrarily beyond their observed range.
After fitting, compare observed and predicted times. Mean absolute error is interpretable in seconds; root mean square error penalises large errors more strongly. Compare the model with a simple benchmark such as the group's mean time or an athlete's last standardised result. If regression does not beat simple predictions on new data, added complexity lacks demonstrated value.
Evaluation observations must not leak into model fitting. Small datasets make train–test separation difficult, and cross-validation methods have their own limitations. Repeated records from the same athlete need appropriate grouping so future information does not indirectly enter model development. Such leakage produces inflated predictive performance that disappears in real use.
Report sample details, event definition, coefficients, uncertainty and prediction errors rather than only a coloured line and r-squared. Exploratory models should be labelled exploratory; external validation should identify the population. Data Lab uses statistics to test whether general strength metrics actually help, not to invent spectacular universal laws.
26. When complex models add less value than a good stopwatch
Multivariable regression and machine learning can combine numerous predictors, but need sufficient observations, consistent information and independent evaluation. Strongman research populations may be small, while implements vary across competitions. An algorithm fitted to fifteen athletes with ten variables can reproduce history almost perfectly and fail badly on new athletes. That is overfitting rather than discovery of hidden physiological law.
A simple benchmark could predict time from the last comparable run. A more elaborate model could incorporate Squat 1RM, body mass and experience. Fair comparison requires the same evaluation data and error definition. If complexity reduces MAE by only one-tenth of a second while manual timing uncertainty is similar, its practical benefit may be limited. Complexity needs demonstrated value.
Algorithms are vulnerable to unrecorded changes: another Yoke, wet asphalt, an added turn or different rules. Without these fields, models may wrongly attribute performance differences to strength or body mass. Additional neural-network layers cannot reconstruct missing observations. Better definitions and data collection should come before more elaborate modelling.
Predictions require uncertainty. A projected 18.7 seconds looks precise, but may be unhelpful for rankings if typical model error is several seconds. In events separated by fractions of a second, approximate predictions may inform broad planning without reliably identifying a podium. Decision stakes should match demonstrated accuracy.
Direct standardised testing can sometimes answer coaching questions better: identical load, course, timing and comparable video. More complex models may complement such tests when enough data exist. They should not automatically replace direct observation when safe testing is available and relevant.
Mature systems review predictions after new competitions, comparing estimates against actual outcomes. Increasing errors may justify recalibration or abandoning the model. Retaining an algorithm purely because it is sophisticated is poor management. Data Lab prioritises reproducible and useful conclusions over spectacular forecasts that fail external checking.
27. Longitudinal case: Squat and Yoke across two cycles
Consider a fictional athlete with a 220-kilogram Squat and a standardised twenty-metre Yoke at 300 kilograms completed in 21.4 seconds. Eight weeks later, Squat reaches 235 and Yoke improves to 20.2 seconds. After another eight weeks, Squat rises to 245 but Yoke remains approximately 20.1. These are illustrative figures, not experimental results. They show that maximal strength and event performance can change at different rates within the same athlete.
During the first cycle, changes are compatible with positive transfer, but Yoke starts, frame adjustment and pacing may also have been practised. In the second cycle, strength improves without substantial race-time change. Newly developed strength need not be useless; another constraint may dominate. Split times, sway, fatigue and measurement methods deserve review before declaring a training programme ineffective.
Suppose the first five metres improve from 6.2 to 5.0 seconds in the opening cycle while later sections change little. Progress appears concentrated at the start. The next coaching question might concern maintaining speed through the latter half. However, three Squat–Yoke observations cannot establish a stable causal relationship. A mathematically calculable correlation does not turn a training history into a controlled experiment.
A future cycle could maintain appropriate general strength work while separately monitoring slower Yoke sections. Better times would constitute meaningful sporting progress even if the exact cause remained uncertain. The log should preserve raw observations, event load, frame identity and technical notes. Its purpose is not to defend the assumption that every kilogram gained in Squat must produce the same time improvement.
Recovery observations and competition results may be added when useful, but parameters should not be invented for an impressive model. A change smaller than the test's ordinary error may remain uncertain. Training and experience often progress simultaneously in real sport. Good data improve decisions without making every association a demonstrated cause.
28. Practical protocol: monitoring transfer without constant maximal testing
An individual monitoring plan can select two general strength references, such as Squat and Deadlift, plus standardised Yoke and Farmer’s tests. Maximal lifts are reassessed when appropriate, not automatically every week. Dynamic events can use relevant, safe submaximal loads and stable courses. Monitoring must support competitive preparation rather than constantly demand more spreadsheet points. If testing disrupts recovery, its cost deserves reconsideration.
Each record includes date, load convention, implement, distance, surface, timing procedure and attempt status. Maximal strength records identify exercise variation, range, accessories and whether the figure was observed or estimated. Farmer’s mass per hand differs from total mass; Yoke values need to clarify whether the frame is included. Video notes can identify slow pickup, sway or drops without turning coaching judgement into medical diagnosis.
Only sufficiently comparable trials should be analysed together. Wet and dry ground differ, course turns add mechanical demands, and handle dimensions affect the task. When conditions change, results can remain valuable sporting history without being treated as controlled progress assessments. Repeatable video and five-metre splits may help on key testing days, but are not compulsory in every normal workout. Measurement quality matters more than indicator count.
A concise report can show Squat and Deadlift history, standardised Yoke and Farmer’s time, pickup splits and drops. When several metrics improve, report their concurrent change. When maximal strength rises and carries remain stagnant, investigate task-specific constraints. Causal claims require appropriate research design, not merely two ascending or descending lines on a chart. Coaches can make sensible decisions while retaining statistical restraint.
Team comparisons require filters for division, experience and testing protocol. Official results shaped by tactical scoring should not automatically be mixed with gym tests performed for maximal speed. Small datasets do not obligate anyone to fit regressions. Comparable observations and well-defined questions can provide a stronger starting point.
29. Simple models, specific training and tactical decisions
As competition approaches, emphasis on general and event-specific work may change according to schedule, recovery and announced events. An athlete with a strong Squat but unstable Yoke might benefit more from frame control and standardised starts than another maximal Squat test. Someone barely lifting the Yoke faces a different force-capacity constraint. Data can identify the distinction, while the final programming decision requires responsible coaching judgement.
Farmer’s athletes can have fast pickups but repeated late drops, or slow pickups followed by steady movement. Grip and pacing deserve attention in the former case; initial mechanics and acceleration in the latter. Prescribing identical Deadlift work simply because both times are weak ignores the event. One-repetition maximum needs interpretation alongside direct movement observations.
In Log for repetitions, greater strength reserve may reduce the relative load, yet clean technique and accepted lockout can determine points. Rejected repetitions may suggest technical issues, while failure on the first attempt may be more closely related to maximal capacity. These cases require different interventions and cannot be distinguished by one percentage of 1RM.
Prediction models have tactical value only when error is small enough for the intended decision. If a model is uncertain by several seconds, it cannot reliably decide who wins a contest historically separated by three-tenths. Predictions may describe possible ranges rather than promise a podium. Comparable event observations and real conditions remain essential.
Repeatable submaximal tests may be preferable to frequent maxima. Experience, recovery and injury history change appropriate workloads, and no universal proportion of Squat, Deadlift and strongman practice exists. Programming should respond to observed moving-event outcomes, not the assumption that one heavier gym lift automatically solves every event.
Data Lab aims to make decisions transparent. Describe available strength, specific results, context and uncertainty, then choose an intervention that can be evaluated. Retain evidence when it works and revise the hypothesis when it does not. This is more rigorous than selecting a flattering equation and forcing training decisions to confirm it.
30. Safety when assessing maximal effort
Data collection does not justify turning every workout into maximal testing. Heavy Deadlift attempts and extremely demanding Yoke runs can create fatigue, especially during high-volume training. A standardised submaximal test may provide enough information about progression without consuming resources needed for preparation. Assessment should reflect the competition phase, athlete condition and apparatus safety. More points on a chart do not automatically make better programming.
Fatigue, new pain, loss of control and ground conditions can change whether testing is appropriate. Neither a commercial recovery score nor a velocity-based estimated maximum certifies medical readiness. Concerning symptoms require appropriate professional evaluation. Software cannot remotely diagnose injury or cardiovascular illness. Performance predictions should never pressure an athlete to continue an unsafe attempt. Modelling should remain subordinate to the athlete's health and informed decisions.
Farmer’s and Yoke testing requires course inspection, implement stability and safe stopping space. When timing fails, an immediate maximal repeat is not mandatory merely to replace a missing value. Records can be marked incomplete and reassessed later. If an athlete stops because of instability or pain, the attempt remains meaningful information even though it cannot be counted as a completed twenty-metre run. Databases must describe reality instead of inventing finishes.
Research testing requires appropriate ethics and risk controls. In coaching, monitoring should serve athletes rather than reverse that relationship. Increasing loads until failure solely to complete a model curve is unjustified. Some measurements can legitimately remain unknown. The potential information gained should be weighed against physical cost, time and whether the result would change a decision.
Intelligent assessment uses the minimum protocol sufficient for the question. When evaluating Yoke start improvement, a comparable submaximal task may be adequate. Official records require appropriate standards and supervision. Neither purpose demands constant testing at the limit. Sustainable performance includes being able to train and compete again, not merely generating another number today.
31. Priorities for future strongman research
Strongman research has already provided evidence concerning strength–performance associations and movement mechanics under distinctive implements. Yet there remains a need for larger longitudinal datasets following the same competitors across seasons, with consistent Squat, Deadlift, Yoke and Farmer’s protocols. Such research could ask whether changes in maximal strength anticipate later changes in timed results while considering familiarisation and fatigue. Cross-sectional associations remain useful but do not answer this question alone.
More diverse samples are essential. Winwood's relevant study used twenty-three semiprofessional rugby players [1], while the 2021 Yoke paper included nineteen strongman competitors [3]. These groups cannot represent every weight class, experience level, masters athlete and strongwoman competitor. Multicentre research with documented apparatus and event rules could improve transferability. Fixed biological differences should not be assumed where direct evidence is limited.
Moderate and near-limit event loads deserve separate investigation. Farmer’s work could record pickup, split times and drops; Yoke research could track velocity and stability; Truck Pull work could document vehicle mechanics and ground conditions. Shared protocols and data dictionaries may improve comparison without requiring every gym to purchase an expensive laboratory. Reproducibility should take priority over the apparent sophistication of technology.
Causal transfer questions require appropriately designed intervention studies. Programmes focused on general strength versus those adding specific practice might be compared under sound methods, but changes cannot simply be attributed to whichever exercise attracts attention. Recovery and athlete safety are essential. Research should not demand unjustified extreme attempts solely to generate extra statistical points. Information gain and participant risk must be considered together.
Until stronger evidence becomes available, existing work supports cautious hypotheses rather than universal conversion laws. We should not invent Squat–Yoke coefficients absent from the literature or turn group relationships into guaranteed kilogram-to-second formulas. Scientific progress depends on consistent definitions, transparent uncertainty and cooperation. A well-formed question can be more valuable than a deceptively precise answer.
32. What makes a model useful for rankings and decisions
A predictive model becomes useful not through an impressive correlation but through estimates accurate enough for the decision at hand. When podium places in Farmer’s are separated by tenths of a second, a mean prediction error of two seconds may make exact rankings impossible to forecast. The same model might still help identify a broad performance range. Utility depends on the purpose and the consequences of error rather than the visual appeal of the chart.
Predictions should be checked on observations excluded from fitting. Trying many predictor combinations among the same ten athletes until the strongest correlation appears invites optimism. Coaches can compare elaborate models against a simple benchmark, such as an athlete's last time on an identical course. When an eight-variable algorithm does not improve prediction beyond that benchmark, complexity lacks demonstrated practical benefit. New data, not the fitted historical curve, determine whether the model works.
Rankings also depend on opponents. An athlete can improve Yoke time and still lose points if rivals improve more. A model predicting raw physical outcomes is not automatically a competition-scoring model, and a projected ranking from one championship may not carry into another. Databases should distinguish time, load, repetition count and official points. Combining them into one index can conceal the very event-specific limitations coaches need to understand.
Team reports should show plausible ranges and data limitations rather than promises of victory. A competitor with a large 1RM but no experience with the contest implement generates substantial uncertainty. Someone with repeated comparable event tests provides a stronger descriptive basis. Even so, fatigue, weather, surface and judging may change outcomes. Prediction capability must be demonstrated and periodically reassessed.
A model is valuable when it improves decisions without creating unnecessary risk or false confidence. Coaches can use it to identify preparation gaps, plan appropriate assessments or select prudent tactics. It cannot become a medical clearance certificate or an obligation to attempt uncontrollable weights. Performance remains a real-world outcome rather than a command issued by software.
33. From 1RM to applied analysis: rules for a Strongman Data Lab
Every transfer analysis begins by defining the maximal exercise and dynamic outcome. Identify Squat, Deadlift or Log, whether the maximum was directly measured or estimated, and which standards applied. For Yoke and Farmer’s, preserve actual mass, course length, apparatus identity, surface and timing rules. A course with a turn is not automatically equivalent to a straight route. Standardisation comes before regression and remains more important than the apparent sophistication of any later formula.
The second principle separates observation from explanation. Higher Squat may accompany faster group times without implying the same causal effect within each person. One athlete may improve Deadlift and Farmer’s together while technique or grip also changes. Cross-sectional correlations and individual development need distinct labels and methodological caveats. Confusing them encourages confident claims that the data cannot support.
The third principle is retaining raw information. Split times, failed attempts, drops and rule changes can be more informative than an overall score. When an observation seems unusual, inspect its source before excluding it. When timing is missing because equipment failed, do not invent a replacement. An auditable database allows others to trace conclusions to observations rather than rely on its author's selective memory.
The fourth principle is evaluating actual model usefulness. A large correlation does not guarantee accurate individual prediction, while r-squared is not a causal percentage. Report errors in practical units such as seconds and evaluate new observations. Simple benchmark models are essential comparisons. Complex methods should not gain authority merely because they require sophisticated software.
The fifth principle concerns the athlete. Measurement must support training instead of becoming more important than the preparation itself. No unnecessary maximal attempts should be demanded for a curve, and recovery scores should not become clinical diagnoses. Qualified professional evaluation takes priority when health is concerned. The best systems make uncertainty visible and facilitate collaboration between athlete and coach.
34. Conclusion: maximal strength creates potential, the event determines results
The relationship between maximal strength and dynamic-event performance deserves study precisely because it is meaningful and imperfect. Squat, Deadlift and Log can provide valuable references for athletic capacities, and available research identifies important associations between conventional gym strength and some strongman outcomes. Yet Yoke, Farmer’s and Truck Pull involve technique, traction, load distribution, acceleration and sustained effort. No matter how impressive, one gym record cannot describe every dimension of these tasks.
Winwood, Keogh and Harris provide relevant empirical associations in their studied population [1], while biomechanical research on Farmer’s and Yoke helps explain differences in movement demands [2–4]. These sources do not authorise universal conversions from Squat kilograms into Yoke seconds. Validated predictions require comparable populations, carefully defined tasks and independent assessment of errors. Even a large correlation coefficient is not a guarantee about the individual athlete. Strongman performance emerges from the interaction of several capacities and the precise competitive situation.
Coaches should identify limiting links. When the competitor cannot pick up a load, maximal force and initial mechanics may deserve attention. When pickup is easy but sway or drops cost time, task-specific skills may be more important. In Log repetition events, the constraint may arise during clean, press, lockout or pacing. Data should help describe what happened, identify useful next tests and inform programme choices, rather than force every problem into one equation.
For researchers, distinguishing cross-sectional correlation from longitudinal improvement is fundamental. R-squared is not a causal percentage, and prediction error needs reporting in useful physical units. For athletes, greater Squat or Deadlift capacity deserves recognition, but competition tests how that strength is expressed in real tasks. Scientific practice means benefiting from available associations while acknowledging the conditions under which they were observed. That restraint strengthens the usefulness of findings rather than weakening the sport's ambitions.
Episode Four will examine execution velocity and the monitoring of strength development, including load–velocity relationships and the limitations of measurement devices. We will continue separating bar speed from travelling speed, and calculated estimates from direct observations. For now, the core conclusion is simple: 1RM offers potential, while dynamic performance reveals how much of that potential can be expressed through the event's actual demands.
Selected scientific references
[1] Winwood, P. W., Keogh, J. W. L., & Harris, N. K. (2012). Interrelationships Between Strength, Anthropometrics, and Strongman Performance in Novice Strongman Athletes. Journal of Strength and Conditioning Research, 26(2), 513–522. https://doi.org/10.1519/JSC.0b013e318220db1a
[2] Hindle, B. R., Lorimer, A., Winwood, P., & Keogh, J. W. L. (2019). The Biomechanics and Applications of Strongman Exercises: A Systematic Review. Sports Medicine - Open, 5, 49. https://doi.org/10.1186/s40798-019-0222-z
[3] Hindle, B. R., Lorimer, A., Winwood, P., Brimm, D., & Keogh, J. W. L. (2021). The Biomechanical Characteristics of the Strongman Yoke Walk. Frontiers in Sports and Active Living, 3, 670297. https://doi.org/10.3389/fspor.2021.670297
[4] Winwood, P. W., Cronin, J. B., Brown, S. R., & Keogh, J. W. L. (2014). A Biomechanical Analysis of the Farmers Walk, and Comparison with the Deadlift and Unloaded Walk. International Journal of Sports Science & Coaching, 9(5), 1127–1143. https://doi.org/10.1260/1747-9541.9.5.1127
[5] Hindle, B. R., Lorimer, A., Winwood, P., & Keogh, J. W. L. (2020). A systematic review of the biomechanical research methods used in strongman studies. Sports Biomechanics, 19(1), 90–119. https://doi.org/10.1080/14763141.2019.1598480
[6] Weakley, J., Mann, B., Banyard, H., McLaren, S., Scott, T., & García-Ramos, A. (2021). Velocity-Based Training: From Theory to Application. Strength & Conditioning Journal, 43(2), 31–49. https://doi.org/10.1519/SSC.0000000000000560
[7] Hopkins, W. G. (2000). Measures of Reliability in Sports Medicine and Science. Sports Medicine, 30(1), 1–15. https://doi.org/10.2165/00007256-200030010-00001
[8] Atkinson, G., & Nevill, A. M. (1998). Statistical Methods for Assessing Measurement Error (Reliability) in Variables Relevant to Sports Medicine. Sports Medicine, 26(4), 217–238. https://doi.org/10.2165/00007256-199826040-00002
[9] Soligard, T., Schwellnus, M., Alonso, J. M., et al. (2016). How Much Is Too Much? (Part 1) International Olympic Committee Consensus Statement on Load in Sport and Risk of Injury. British Journal of Sports Medicine, 50(17), 1030–1041. https://doi.org/10.1136/bjsports-2016-096581
[10] Saw, A. E., Main, L. C., & Gastin, P. B. (2016). Monitoring the Athlete Training Response: Subjective Self-Reported Measures Trump Commonly Used Objective Measures: A Systematic Review. British Journal of Sports Medicine, 50(5), 281–291. https://doi.org/10.1136/bjsports-2015-094758
[11] Bland, J. M., & Altman, D. G. (1986). Statistical Methods for Assessing Agreement Between Two Methods of Clinical Measurement. The Lancet, 327(8476), 307–310. https://doi.org/10.1016/S0140-6736(86)90837-8
[12] Winwood, P. W., Keogh, J. W. L., & Harris, N. K. (2011). The Strength and Conditioning Practices of Strongman Competitors. Journal of Strength and Conditioning Research, 25(11), 3118–3128.
More From The Journal
Training
The Science of Strongman Training - Episode X: Competition Programming
How to build a complete Strongman competition preparation block: calendar, events, volume, intensity, specificity, simulations, autoregulation, tapering and fatigue management.
Training
The Science of Strongman Training - Episode IX: Peaking
Peaking in Strongman: how to turn months of training into maximal competition performance by reducing fatigue, preserving adaptations and managing specificity.