
Training Science
Series: STRONGMAN DATA LAB: HOW WE MEASURE AND ANALYSE PERFORMANCE - Episode 2: Building a Training Database
October 15, 2026
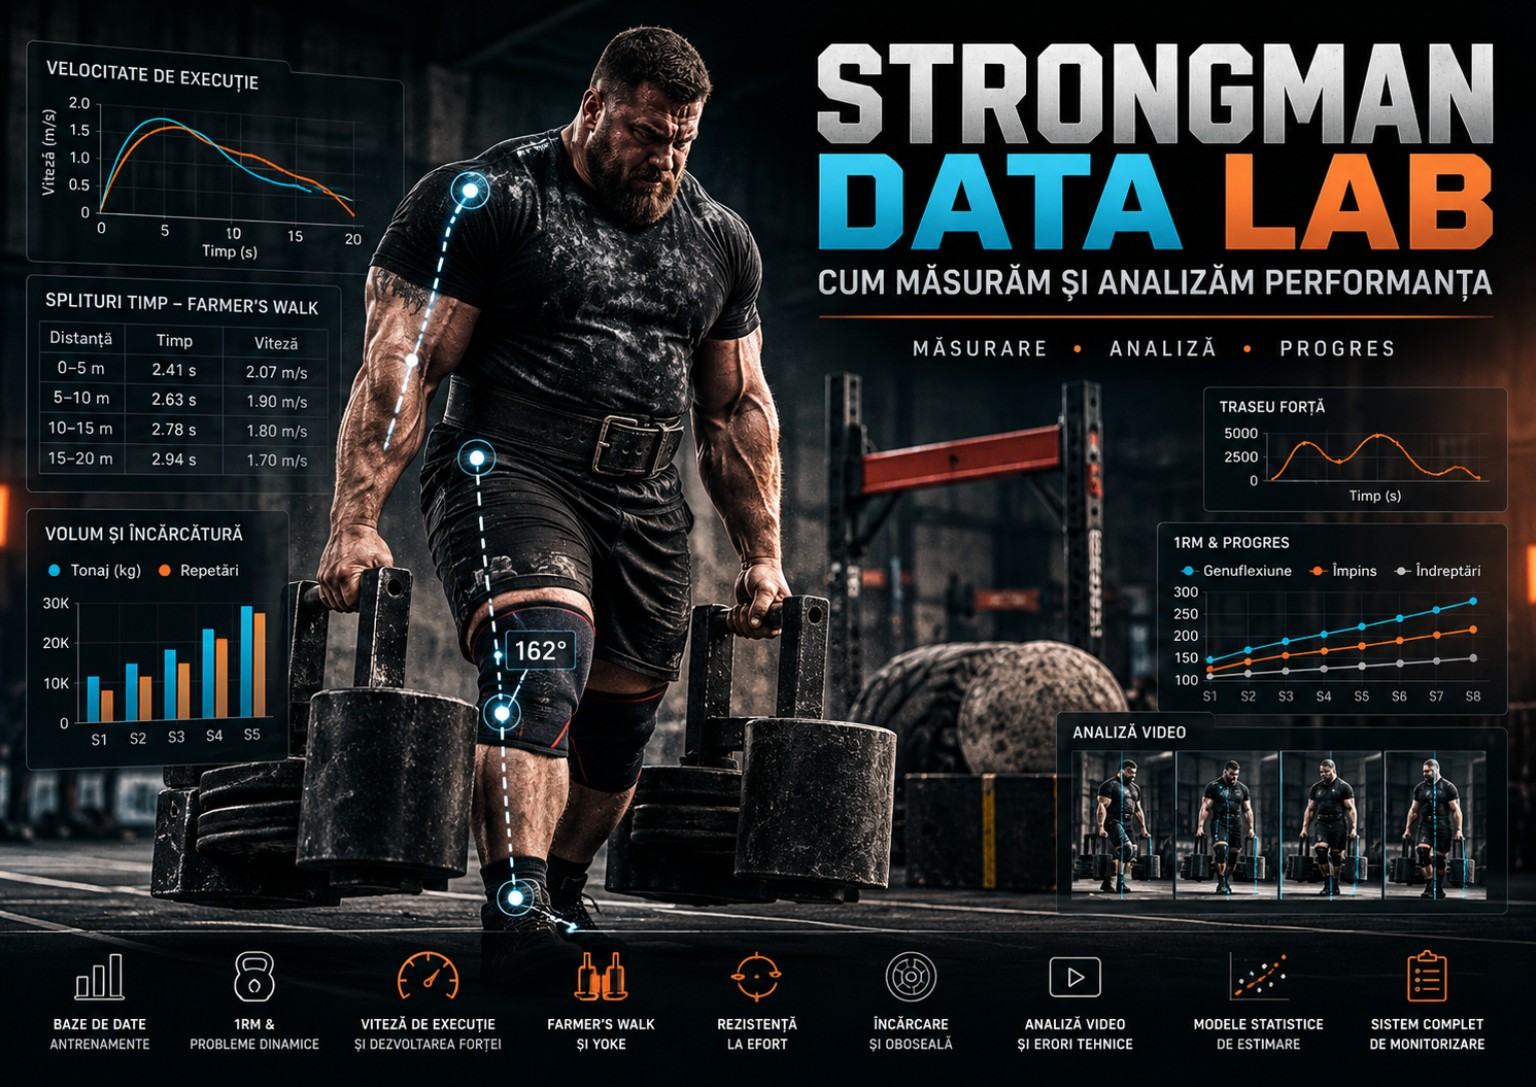
Almost every strongman training session generates information. Loads, distances, repetitions, completion times, unsuccessful attempts, equipment variations, fatigue notes and technique videos accumulate rapidly. Yet remarkably little of this material remains rigorously comparable after several months. A number on a phone, a video sent to a friend and a photograph of a competition result become isolated fragments. Turning them into a useful performance history requires a database organised around the sport itself, not around the visual appeal of a dashboard.
This is Episode Two of STRONGMAN DATA LAB: HOW WE MEASURE AND ANALYSE PERFORMANCE. The first episode established what measurable performance means; this one builds the infrastructure needed to preserve and compare observations. A database is more than a file containing rows and columns. It is a system of definitions, data-entry rules, identifiers, relationships and checks through which an outcome can be retrieved and explained. If two years from now nobody can explain what Farmer’s 130 meant, the original number has lost much of its apparent value.
We will design a model that can serve an athlete using a basic Excel workbook and a coach managing several competitors, without pretending that these scenarios have identical technical requirements. Athletes, sessions, exercises, apparatus variants and individual attempts will be distinguished. We will define when a load is expressed per hand, how total Yoke mass should be recorded, how a Medley can be represented and why zero repetitions does not always indicate an unsuccessful attempt. Every structural decision should remove ambiguity rather than multiply unnecessary fields.
Sports data do not become more accurate simply because they are digitised. If the course is shorter than the recorded distance, calculated speed will be wrong. If a referee rejects a repetition and it is recorded as accepted, the model describes a different competition. If an athlete uses different implements between weeks, a change may arise from equipment rather than physiological adaptation alone. Data quality is consequently a biomechanical and methodological question as much as a technical computing problem.
The following sections combine explanation with numerical examples and practical table designs. We will develop a data dictionary, unique attempt identifiers, rules for missing values, logical validation, load and speed calculations, CSV imports, video organisation, backups and a minimal coaching dashboard. Examples are hypothetical and educational, not medical or competitive observations collected from real people. References span strongman performance research, measurement reliability, workload monitoring and responsible scientific data stewardship.
It can be tempting to begin with charts. That order often creates a fragile structure: an attractive application populated by numbers that do not mean the same thing. We will reverse the process. First come the questions; next the measurements and their definitions; then comparability checks; and only afterwards indicators and visualisations. A sound system need not be expensive, but someone who was not present at training should still be able to understand what happened, what remains unknown and which conclusions are supported.
The purpose is not to turn strongman into a sport controlled by computers. Coaches observe technique, athletes experience effort and official rules determine results; a database should preserve these different perspectives and connect them without conflating them. By the end of the episode, we will have a concrete model capable of starting with a handful of rows and growing without destroying earlier history. That is the real purpose of a strongman data laboratory: somewhere training memories can be checked rather than merely admired.
1. The question comes before the spreadsheet: why collect data?
A useful database begins with coaching questions. Do we want to know whether Yoke performance improved over the same distance, whether Farmer’s speed decline consistently begins after fifteen metres, or whether weekday Deadlift volume relates to weekend performance? Each question requires different variables. Recording only load and repetitions cannot support speed analysis, while retaining only a finishing time cannot distinguish the start from the final segment. Information quality depends on the match between what we want to learn and what we actually observe.
Purposes can be divided into three levels: training documentation, progress monitoring and decision support. Documentation allows a session to be reconstructed. Monitoring demands comparable observations through time. Decision support involves cautious interpretation rules, such as repeating a test when an outcome appears unusual. A complex predictive model is not required to record three Log sets correctly. A sound architecture permits gradual expansion without changing the meaning of historical information.
An objective as broad as measuring everything quickly produces abandoned fields. Athletes complete some values carefully and omit others, weakening comparability. It is preferable to begin with a few important questions: what load was lifted legally, how fast was the standard course completed, how many attempts were invalid, how difficult did the work feel and which conditions changed? Additional indicators can be introduced after several weeks when they offer realistic benefits to training decisions.
Competition data serve a different purpose from training data. In a contest, standings depend on scoring rules and opposing results, while an athlete may stop once sufficient points are secured. In the gym, the same exercise may involve additional repetitions intended to develop capacity. Mixing those outcomes without context can make tactical competition behaviour look like a performance decline. Each record therefore needs a session purpose or context classification.
Success criteria can be defined for the database as well as the athlete. After three months, we should be able to retrieve every standardised Farmer’s test at 120 kilograms per hand, compare times on the same course and explain why some observations were excluded from progression analysis. If the file cannot answer such questions, row count is not a useful quality indicator. A small coherent dataset often supports better decisions than a large collection of ambiguous notes.
The purpose of the system is to reduce relevant uncertainty. It will not prescribe every training decision by itself, but it can counter selective memory and repeated interpretive errors. Well-defined questions filter the choice of fields, sensors and reports. Every additional field should justify the time needed to complete it through a plausible benefit to understanding actual performance.
2. The conceptual model: athlete, session, event, attempt
Before opening Excel, decide what a row represents. If one row means an entire training day, a session containing Squat, Log and Farmer’s will cram incompatible variables into one structure. If each row represents an attempt, detailed observations are possible, but shared information will repeat. The logical solution is to distinguish entities: athlete, session, event or exercise, implement, set or attempt, and outcome. These may live in separate spreadsheet tabs or relational tables depending on project size.
An athlete entity identifies the person through a stable code without requiring excessive personal information. A session carries date, time, location and training purpose. One session may contain several activities, such as Yoke at a stated load followed by volume Deadlift. Each activity may contain multiple attempts, some complete and some terminated. Results belong to the exact attempts that generated them. This hierarchy prevents planned workload from being confused with what was actually performed.
For example, athlete A01 attends session S20261015A, including the YOKE20 event. The first attempt uses 280 kilograms and takes 16.8 seconds; the second uses 300 kilograms and takes 18.3 seconds. Both records identify the same athlete, session and course definition. They appear on separate rows, preserving attempt order and loading. These are hypothetical values. The model explains their relationship without needing to copy the full session description into every measurement.
Spreadsheet implementations can begin with a simpler structure that repeats some information. Immediate adoption of a SQL database is unnecessary. However, field meanings must remain stable: a column called time_s cannot describe overall session duration in one row and one repetition's time in another. Different levels of time need different fields or tables. A clear conceptual model can be implemented using modest tools.
Distinguishing an exercise family from its variants is particularly important. Conventional Deadlift, Axle Deadlift and Rack Pull from a higher starting point belong to a broad family but are not interchangeable tests. Similarly, a straight Farmer’s course differs from a route with a turnaround. An exercise_definition entity can describe the family, while an event_variant records the specific task. Analysts can then examine all Deadlift-related work without pretending the individual records are equivalent.
The conceptual model also reduces entry errors. Unique implement codes remove repeated free-text descriptions. Linking attempts to existing sessions prevents orphaned results without date or context. Before automating these relationships, they should be explained to everyone entering data. A technically elegant structure that nobody understands is not a good training tool.
3. Unique identifiers: preventing records from becoming confused
A unique identifier distinguishes one record from every other record even when visible values match. Two Farmer’s attempts can both use 120 kilograms and finish in 20.0 seconds without being the same attempt. If date and exercise name alone serve as a key, a second entry may overwrite the first. An attempt_id field prevents this problem. Identifiers should remain stable and must not be reused after a record is deleted or a session changed.
Valid strategies include a database-generated number, UUID or readable code such as S20261015A-YOKE-02. Readable identifiers assist debugging but can become fragile if names or ordering change. Automatically generated identifiers are generally suitable for larger systems, while human-friendly labels remain separate attributes. Relationships should not rely on mutable information such as the session title or the athlete's displayed name.
Different entities require different identifiers. athlete_id identifies a person, session_id a training event, exercise_id the movement type, implement_id the apparatus and attempt_id the actual observation. An attempt can contain references to the other entities. If an athlete changes a nickname, history remains intact because athlete_id is unchanged. If an implement is repaired or painted, its identifier can persist with a separate modification record.
In a small workbook, identifiers can be generated through a simple rule and checked for duplication. With multiple athletes, automatic generation is preferable. The codes need not carry sporting meaning. A code such as A017 is not a ranking and should not change when the athlete moves divisions. Treating identifiers as performance labels creates unnecessary historical inconsistencies.
Records imported from several sources need reconciliation rules. An official result retrieved from an organiser's website and the same attempt entered manually should not become two independent outcomes in analysis. Different measurement sources can be linked to one attempt, or a suspected duplicate can be flagged for checking. Automatic deduplication based only on time and load is dangerous because distinct real attempts can have identical measurements.
An auditable system also stores who created a record, when it was entered and, where relevant, when it was corrected. These metadata need not be publicly visible. They support investigation of differences between video timing and official results. Stable identifiers also make future software migration possible. A database that preserves its relationships on export is more valuable than an impressive dashboard whose links break when moved elsewhere.
4. The data dictionary: every column has a definition
A data dictionary documents the meaning, unit, format and rules of every field. In a spreadsheet, it can occupy a dedicated tab. For load_kg, specify whether the value means total implement mass, mass per hand or plates added to an apparatus. For duration_s, define whether rests are included. For repetitions_valid, explain that only movements accepted under the stated protocol are counted. Without definitions, different users enter different information into apparently identical columns.
A sound dictionary includes the field name, description, data type, unit, permitted values, whether it is required and an example. The distance_m field can be a non-negative number in metres, applicable to movement events. attempt_status might permit completed, failed, stopped, disqualified or not_started, each precisely defined. If a test has no distance, the field is not applicable rather than zero. This distinction becomes important when calculating speeds or summary statistics.
Units need a consistent policy. Systems may store all masses in kilograms, distances in metres and time in seconds, with conversion at import or presentation. If a contest uses pounds, the original figure can be retained with its source alongside a standardised conversion. Centimetres and metres should not be silently mixed in one field. A factor-of-one-hundred mistake can produce spectacular graphs and wholly false conclusions.
Text categories should be standardised where possible. If the same event is recorded as farmers, farmer walk, Farmer's Carry and F.W., simple searches can miss observations. Use an event code such as FARMERS_WALK alongside a readable display name. Surfaces may be categorised as dry asphalt, wet asphalt, concrete, artificial turf or unknown, without claiming those words describe every mechanical property. Free text remains useful for observations that cannot reasonably be reduced to categories.
The dictionary should describe data origin: measured, calculated, estimated or declared by an organiser. An observed one-repetition maximum differs from an equation-based estimate. Average speed derived from distance and time differs from peak velocity measured using video. Without origin labels, derived metrics can be mistaken for direct measurements. Provenance is therefore part of scientific comparability.
Dictionaries evolve, but changes must be versioned. If load_kg originally meant mass per hand, redefining it later as total mass without transforming and documenting historical values would be dangerous. A new version might introduce load_per_hand_kg and total_load_kg while preserving compatibility with older records. This is an ordinary procedural discipline that prevents expensive mistakes after hundreds of sessions.
5. Data types, missing values and actual zero
Information systems distinguish numbers, text, dates, Boolean values and absent information. Sports records need the same discipline. A time of 23.4 seconds is numeric, the note wet handle is text, and 15 October is a calendar date rather than an ambiguous string. Combining incompatible items inside one field makes calculation and checking difficult. Data types are not merely a programmer's concern; they determine which operations are valid.
Zero has a concrete meaning. Zero repetitions may mean an athlete started but completed no accepted repetitions. If they did not attend or the event was cancelled, zero would misrepresent what happened. Likewise, zero seconds is not a valid race completion time, while zero drops is a perfectly legitimate observation. Databases must distinguish true zero, unknown, not applicable and missing because of collection error.
In spreadsheets, blank cells may conceal several different meanings. An additional missing_reason field can distinguish not_measured, equipment_failure, not_applicable, lost_record or withheld where important. Every blank cell does not need a separate explanation, but missingness that influences analysis should be documented. If timing equipment fails, the athlete may still have completed the course, although the precise duration is unavailable. That is not the same as a failed attempt.
Calendar formats should avoid confusion between day and month. A date such as 05/06/2026 may mean 5 June or 6 May depending on the application. ISO 8601 date and time representation supports reliable exchange. Recording time zones is useful for international competitors; otherwise a session near midnight can move to another calendar date after import. Local time still matters for interpreting the workout's practical context.
Free text is valuable, but typing it where numbers belong can break calculations. The entries 120 kg, 120k and the number 120 may look similar yet behave differently in software. Store the numeric value in a numeric field and specify units separately. Likewise, 1:20 may be treated as a clock time instead of a duration if formatting is unclear. Normalisation before analysis prevents mistakes that would otherwise be difficult to notice.
Sometimes the correct representation of what we do not know is an explicitly missing value. We should not retrospectively invent an unrecorded exertion rating because a load looks heavy, or guess a sandbag's mass from a photograph. A database with documented gaps is more credible than a supposedly complete one filled through assumptions. Analysis may exclude selected observations or apply appropriate methods, but those decisions must be explained and cannot magically recover information that was never collected.
6. Implement records: one Yoke is not necessarily another
Strongman implements are not interchangeable platforms for weight plates. Dimensions, weight distribution, handle height and geometry alter execution. Two Yokes can share total mass while different crossbar heights change trunk position and apparatus control. Farmer’s handles of equal mass can differ in diameter, spacing and pickup height. Comparisons therefore require an implement identity independent from the load used during a particular attempt.
An implement record may include implement_id, name, category, unloaded mass, relevant dimensions, storage location and the most recent known inspection. For an adjustable Yoke, bar height belongs in the attempt or setup because one frame supports multiple configurations. For Farmer’s, grip diameter and apparatus length may matter. Atlas Stones may require diameter and surface descriptions, while measured mass can have different certainty from a painted number.
Not every dimension needs to be mandatory. A gym owning only one Log may begin with a stable code and clear description, adding dimensions when a comparison requires them. The goal is to avoid confusion, not turn every session into an engineering project. An athlete travelling among multiple gyms or contests benefits more directly from implement-specific identification. Labels and reference photographs can help document objects accurately.
Unloaded implement mass must be distinguished from added plates to prevent double counting. If a Yoke frame weighs 100 kilograms and carries 240 kilograms of plates, total mass is 340, neither 240 nor 440. A system may store implement_mass_kg, added_load_kg and an explicitly calculated total_load_kg. Fixed-mass objects can use one total figure. Implements with detachable components need calculation rules clearly recorded.
When an implement changes substantially, decide whether to keep its identity with a new version or issue a distinct identifier. Replacing Farmer’s grips with a different diameter directly affects comparability, so silently reusing the same code is dangerous. A modification history supports analysis before and after equipment changes. Such tracking is particularly relevant for velocity assessment and long-term progression.
Strongman biomechanics studies establish that events and implements have distinctive demands, but cannot supply a universal list of dimensions worth recording. Choose variables around specific questions. Yoke comparison may require bar height; Deadlift records may require bar type and start height. An implement record is therefore a defence against simplistic inference rather than a decorative inventory.
7. Maximal lifts: storing successful and unsuccessful attempts
In maximal Log, Axle and Deadlift events, the most visible outcome is the heaviest accepted load. For analysis, the complete attempt history may be more informative than the day's best number. An athlete completing 110 and 120 kilograms and then failing twice at 130 experiences a different workload from someone performing one successful 120-kilogram lift. Warm-up and official attempts can be distinguished because they have different purposes and rules. Planned loads should never be confused with actual attempts.
Each attempt receives its mass, sequence, accepted or rejected status, possible reason for rejection and confirmation method. Referees may disallow a lift because of incomplete lockout or missed commands. In training, coaches may use an explicitly defined standard. Writing only 130 × 1 is insufficient when it is unclear whether the repetition counted. A sound database can calculate the best accepted result automatically while retaining failures.
Official records and gym records have different status. A gym personal best is valuable but should not be displayed as an officially confirmed competition result. Likewise, a one-repetition maximum calculated from three or five repetitions is an estimate, not a completed maximal attempt. Fields such as result_context and measurement_method maintain these distinctions. This prevents misleading comparisons and exaggerated accounts of performance development.
Deadlift equipment and range of motion also matter. Conventional floor pulls, elevated Rack Pulls, Axle Deadlift and other variants are not automatically equivalent. Straps, suits and relevant accessories can affect comparability. Record interpretation requires clarity about bar mass, disc dimensions and lockout standards. A generic Deadlift label cannot resolve such differences without an event variant definition.
An attempt_outcome field might distinguish successful, rejected for technique, physically unsuccessful, abandoned and disqualified. Where known, lack of force should not be confused with failing to follow a command. Nevertheless, assigning exact reasons may be subjective, requiring source and uncertainty labels. Unknown reasons should remain unknown rather than be replaced with convenient explanations.
Warm-up observations may help with velocity monitoring but should not clutter the official results report. Appropriate filtering can distinguish maximal tests, technical training and preparation sets. Coaches requesting best confirmed lifts receive accepted outcomes; those investigating fatigue may also inspect total attempts. One data point should not be forced to answer every question through one ambiguous label.
8. Farmer’s Walk and Yoke: identical distances, different protocols
Moving events require more context than event name and finishing time. Farmer’s loading is usually expressed per hand, though posters may report total mass. Yoke figures may include the frame and plates. Courses can cover ten, twenty or forty metres, with or without turns, on different surfaces. Reliable comparisons require load, load convention, course length, route, turns, ground condition and the timing-start protocol.
An attempt can finish without interruption, finish after dropping the implements or stop halfway. These outcomes cannot be represented through finishing time alone. If an athlete stops at fourteen metres, elapsed time remains useful but is not a valid twenty-metre completion time. Store distance_completed_m and outcome_status separately. Competition ranking can then use distance advanced when rules require, without incorrectly mixing incomplete attempts into speed charts.
Split times can be stored in a separate table linked through attempt_id. A twenty-metre route may have four five-metre sections, although other events use different divisions. Each split needs a start landmark, finish landmark, duration and measurement method. If pickup is included, the opening section is not directly comparable to the middle sections as pure walking speed. The split table should follow the actual competition or training definitions.
Consider a hypothetical Farmer’s run at 120 kilograms per hand over a straight twenty metres, with an official time of 21.4 seconds and splits of 5.9, 5.0, 5.1 and 5.4 seconds. The segments add to 21.4, a useful consistency check. If they total 19.8, some interval may be absent or boundary definitions may differ. We should not silently correct values through assumption. Review footage and preserve each time's source.
Yoke crossbar height and sway may affect movement rhythm. Farmer’s grip diameter and drops can alter results. A database permitting strict comparison of identical variants and separate exploration of diverse competition outcomes provides complementary perspectives. The first supports longitudinal progress; the second preserves sporting history. Mixing them can generate false conclusions about loaded locomotion.
Not every workout requires every metric. A volume day may need only load, distance, number of runs and perceived effort. A standardised test may justify split timing, video and technical notes. The system should support both, identifying the precision and purpose of collection. Absent split data in a routine training session should not automatically be treated as an athlete or coaching failure.
9. Repetition events: distinguishing attempts from accepted work
In a repetition Deadlift event, the official score is the number of accepted repetitions within the specified limit. Load and time cap must accompany the count. Eight repetitions in sixty seconds at 200 kilograms are not directly comparable to eight in ninety seconds at 240. Training records may also include attempted and invalid repetitions with rejection reasons when sufficiently known. Competitive scoring and total exertion describe different dimensions.
A rejected repetition can still impose substantial muscular demand even though it earns no points. If an athlete attempts ten Log repetitions but only seven count, total attempts describe part of mechanical exposure, while seven is the official result. Keeping only seven may underrepresent actual work; recording all ten as successful falsifies the contest. Databases should preserve both totals without conflating them.
Each repetition can be stored in a child table, with validation time and status, or only aggregated totals can be retained in a simple system. Detailed records support pacing and rest-interval analysis. Aggregates are sufficient for comparing counts under identical conditions. High-resolution collection is unnecessary when no question concerns pacing or technical deterioration.
Standards vary across awkward-object events. Sandbag Over Bar requires a complete passage over the specified height, while Log may require stable lockout and a lowering command. Record the applicable protocol and, where needed, the competition rule version. A repetition rejected for incomplete lockout should not automatically be labelled lack of strength. Video review may assist classification, but some causes remain interpretive and require caution.
Timing data can describe rhythm through repetition-validation timestamps, intervals and periods of rest. Yet the gap between accepted repetitions is not necessarily concentric movement velocity; it includes lowering and preparation. A separate protocol is required to measure bar speed. Treating total interval time as a measure of muscle speed confuses constructs. Accurate data definitions prevent these mechanical errors.
Training sets may deliberately stop before failure to preserve repetitions in reserve. A competition athlete may stop tactically after gaining needed points. Capturing planned_reps, completed_reps and stop_reason can preserve such context. Lower counts do not automatically indicate regression. When the reason is unknown, leave it unknown; the model should accommodate uncertainty rather than conceal it through speculation.
10. Medleys, Atlas Stones and combined tasks: one result, several stages
A Loading Medley is not necessarily one movement. Athletes may lift and carry three bags followed by two stones over different distances and platforms. Scoring can involve total time, number of completed objects or a rule-defined combination. A record reading Medley: 53 seconds cannot show where time was lost or whether another session used an identical setup. Meaningful analysis requires logical stages linked to the final outcome.
A medley_definition entity can describe object order, mass, course length, platform height and time limit. Each segment receives an identifier, with completion and timing in a related table. An abandoned object is not equivalent to a legally loaded one, so status must be preserved. If an athlete completes three stations but times out at the fourth, both the official outcome and exact stopping point can be recorded.
In Atlas Stones, individual masses and platform heights can vary. A progressive stone series cannot be treated as five equivalent repetitions. If the final stone is considerably heavier or the platform higher, demands differ. Each station can be recorded as STONE01 through STONE05 with its parameters. This allows analysis of transition improvement or repeated difficulty at a particular object.
Time between objects may contain unloaded travel, grip adjustment and preparation for another lift. These intervals should not automatically be labelled recovery time. They are transitions within a complex task requiring video or defined timing for interpretation. If officials delay confirmation, the resulting interval does not describe physical capacity alone. Context notes can prevent mistaken conclusions and identify organisational effects.
Competition order is prescribed and may differ from training arrangements. Valid longitudinal comparison requires the exact configuration. Segment times can be aggregated to reconstruct totals; totals alone cannot reconstruct every transition. Preserving lower-level observations offers long-term flexibility. Routine sessions need not be filmed with multiple cameras, but important tests deserve sufficient detail.
The same logic applies to events combining Log, Deadlift, carrying and other tasks under one clock. Define completion, required order and tiebreak rules before producing statistics. Rule changes require new event versions. When the model respects real event structure, analysis becomes more informative without inventing an unvalidated medley index.
11. Planned, completed and accepted: three levels of training
A training plan is an intention, not evidence of completed work. If a coach prescribes five sets of five repetitions at 180 kilograms but the athlete performs four sets and stops because of pain, the database needs both facts. Planned sets and repetitions describe the prescription; actual sets and repetitions describe execution. Where relevant, validated repetitions describe only movements meeting the technical standard. Confusing these levels creates inaccurate workload reports and conceals important modifications.
One structure uses a plan_item entity with exercise, parameters and objective, while completed attempts link to it. If the athlete substitutes Sled for Yoke because equipment is unavailable, the replacement should be recorded as performed without retrospectively rewriting the original plan. This permits examination of adherence and necessary flexibility. Deviations are not automatically problematic; sensible programme adjustment is often appropriate.
Intensity likewise has planned and actual meanings. A set prescribed at RPE 7 may feel like RPE 9 during a fatigued session. That is coaching information, not an error to be overwritten with the planned value. If load is reduced to maintain perceived effort, record both the initial prescription and final outcome. It then becomes possible to investigate whether adjustments are repeatedly needed on a particular day.
For moving events, the plan might contain three twenty-metre runs, while actual performance includes two complete runs and a twelve-metre partial attempt. Storing only three overstates completed volume; storing only two loses a real exposure. Attempt-level records retain each actual distance. Summary measures can separately report metres travelled, complete runs and stopping reasons.
Reasons for modification may help, but should not invite excessive personal surveillance. Categories can include technical change, equipment constraint, fatigue, pain, limited time or tactical choice. Medical symptoms require appropriate access restrictions. A training database is not automatically a clinical record, and coaches do not need every private detail to modify a programme.
Separating prescription from execution supports mature interpretation. Progress sometimes follows a timely reduction in workload rather than rigid completion of every planned number. Conversely, disappointing results may reflect partial execution of a plan for external reasons. Without this context, conclusions about programme effectiveness are weak. A reliable database describes reality instead of rewriting it to resemble the original intention.
12. External volume: tonnage is useful only within its limits
Volume is a common strength-training term with several meanings. For barbell repetitions, a simple calculation multiplies load by repetitions and sums across sets. Moving events can be described through accumulated distance or number of runs. Neither variable represents complete physiological loading in strongman. Databases should permit task-specific summaries instead of forcing every event into one supposedly universal unit.
Consider hypothetical sessions of five sets of five at 150 kilograms and three sets of three at 220 kilograms. Simplified tonnage is 3,750 kilograms in the first and 1,980 in the second. This does not prove that the first session was physiologically harder or more hazardous. Relative intensity, rest, speed, technique and proximity to failure shape the response. Tonnage describes cumulative mass handled under an accounting convention, not complete mechanical work or fatigue.
For Yoke, simple exposure can be described by accumulated metres at each load. Four twenty-metre runs at 300 kilograms yield eighty metres of loaded travel. Two forty-metre runs may cover the same total distance but differ in course demands and recovery. Multiplying mass by distance gives a descriptive kg·m indicator, not automatically the mechanical work performed. The latter requires relevant force components through displacement.
Farmer’s calculations must specify whether the load refers to one hand or both together. Two 120-kilogram handles weigh 240 kilograms in total. An undefined load_kg field can introduce a factor-of-two error. Both figures can be stored with a transparent mathematical relationship. Distance, drops and incomplete attempts provide additional context for the same loading summary.
Aggregate indicators should remain exercise- or family-specific rather than blindly mixing Log, Deadlift, Yoke and Stones into one volume score. Following Deadlift tonnage, Yoke metres and Atlas loading counts separately retains useful biomechanics. Their distribution across the week can then be interpreted alongside recovery and performance. A single enormous number is easy to display, but often conceals rather than clarifies the training stimulus.
Automatic calculations are helpful as long as raw observations remain available. If the definition of volume changes next year, the history should be recalculable. Keeping only aggregates is risky when errors are discovered or better questions arise. Data Lab treats tonnage as a descriptive tool rather than a complete measure of stress or a clinical predictor of injury.
13. Internal load: RPE, perceived effort and interpretation limits
Two sessions with identical external loading may feel very different. A rested athlete may complete 180 kilograms with moderate difficulty, while the same task after a short night feels much harder. Internal load attempts to describe the athlete's response rather than only the mass on an implement. RPE and session-RPE are practical measures, but they need clear definitions. Not every number between one and ten represents the same scale or assessment moment.
Set RPE, sometimes related to repetitions in reserve, differs from session-RPE describing the whole workout. In Foster's session-load method, session duration in minutes may be multiplied by a global perceived-exertion rating when the protocol is applied consistently. The resulting arbitrary units can support internal comparison, but do not measure energy expenditure. They should not be confused with mechanical tonnage or the intensity of a particular repetition.
Strongman includes days of few maximal attempts and days involving long carries or repetitive tasks. A short maximal Log session may feel extremely demanding despite limited active exercise time. On another day, Farmer’s and Sled work can accumulate considerable fatigue at lower nominal loads. A global rating may reveal trends but conceals differences between stimuli. It becomes more useful alongside the types of events performed.
The timing of perceived-exertion collection should be standardised. A rating immediately after the final set and one recorded two hours later may reflect different experiences. A protocol should identify the intended timing and scale. Requiring dozens of ratings every session is unnecessary and may reduce adherence. The goal is comparable useful information rather than constant interrogation.
RPE is subjective, but subjectivity does not make it worthless. Research on athlete self-reporting suggests such measures can reflect meaningful changes in training state. They are not diagnoses, however, and can be influenced by motivation, experience, wording or coaching pressure. When athletes fear criticism for reporting difficulty, they may enter inaccurate values. Measurement quality depends partly on trust.
Attempt RPE, exercise RPE and session-RPE belong in separate fields with appropriate timing and scale definitions. Trends can be considered alongside performance, sleep or workload distribution without automatically claiming causation. Repeatedly rising ratings alongside worsening outcomes may prompt recovery or programme review. A single rating cannot certify overtraining or medical readiness for maximal lifting.
14. Dates, timestamps and the chronology of progress
Progress unfolds over time, and the database must preserve chronology. Sessions have local dates and perhaps start and end times, while attempts may require only an order within the session. Recording the exact second of every ordinary repetition is unnecessary. For pacing analysis, however, time relative to an event's start is essential. Temporal resolution should follow the analytical question rather than the maximum precision offered by a device.
Time zones matter for travelling competitors. If a contest begins at 10:00 local time in another country and software incorrectly converts it to Bucharest time, the displayed date can shift. ISO 8601 timestamps with time-zone information support consistent interpretation, while local dates can remain available for display. Systems should not convert everything to UTC while losing the athlete's actual event context.
Weekly comparisons require a stable week definition. Some tools use Monday through Sunday, others Sunday through Saturday, and some follow ISO week numbering. Changing conventions mid-season can make weekly totals appear displaced. Annual plans may identify preparation, competition, recovery and off-season phases, but labels require care. Not every week serves the same purpose, so comparisons still need context.
Official events may continue beyond midnight, while multi-day competitions contain several calendar sessions. Session_id should preserve links across attempts even when local dates change. Using data-entry date as event date is a common mistake: when an athlete writes Sunday's log for a Saturday contest, the competition remains a Saturday event, while Sunday may separately record entry time.
Record modification time differs from event time. created_at and updated_at are technical metadata; performed_at describes the activity. This permits retrospective correction of a result without falsifying sporting chronology. A video analysed two weeks later belongs to the original attempt, with analysis date and source recorded separately. A longitudinal chart should not move historical points into the present when their values are corrected.
Correct dates enable frequency questions: how many Log sessions occurred in four weeks, when was the last Yoke simulation, and how much time separated competitions? Without chronology, these answers are fragile. Continuous precise location tracking is unnecessary. Record the time information relevant to the sporting task without collecting excessive private data.
15. Excel or Google Sheets: a practical first implementation
For one athlete, a spreadsheet may be entirely sufficient. Purchasing specialist software is unnecessary to begin recording attempts. It is useful, however, to distinguish at least four tabs: dictionary, sessions, attempts and implements. Competition and video observations can be added later. The goal is not the number of tabs but the ability to retrieve conditions surrounding a result.
In Sessions, each row contains session_id, athlete_id, date, session type and general notes. In Attempts, each row contains attempt_id, session_id, event_variant_id, implement_id, load, distance or repetitions and outcome. Implements describes known apparatus. Linking by session_id permits retrieval of everything performed in one workout without repeating general session information. Beginners may start with fewer sheets, but a clear separation simplifies later growth.
Dropdown lists and cell validation reduce mistakes. attempt_status might permit completed, failed, stopped and not_started, while context can use training, test, simulation and competition. Controlled categories are safer than unpredictable free-text variations. Numeric columns can reject negative values, and date formats can be standardised. Automated warnings cannot guarantee biological correctness, but they eliminate common mechanical errors.
Formulas should describe indicators derived from stable underlying measurements. Total load can be implement mass plus added plates, and average speed can equal distance divided by positive completion time for a completed course. In incomplete attempts, calculations need explicit alternative definitions or should remain unavailable. Formulas displaying a false zero when necessary inputs are missing should be avoided. Blank and zero are different values.
One spreadsheet risk is accidental editing of calculated cells. Protecting formula columns and keeping periodic backups helps. Another risk arises when several people edit without clear responsibilities. Teams may need editing permissions, version history and shared entry standards. Elaborate bureaucracy is unnecessary; it should simply be clear who records, verifies and approves corrections.
With thousands of attempts, spreadsheets may remain convenient for display while a relational backend becomes more appropriate. Migration is easier when stable identifiers, consistent units and defined tables already exist. A simple workbook constructed carefully is therefore an investment in future capability. Software price is secondary to the quality of the information structure.
16. A relational model: tables that can grow without chaos
A relational model stores entities in linked tables. Athletes do not need to manage a server to understand the principle. Athlete contains competitors; Session describes workouts; EventDefinition defines tasks; Implement identifies apparatus; Attempt stores individual observations; and Split holds segment times. Identifiers connect them. When an attempt belongs to session S105, its session_id points to the corresponding session without duplicating dates and locations.
Separation reduces update anomalies. If an athlete changes their display name, it is edited once in Athlete. If the name has been copied five hundred times into Attempt, some rows may retain older variations. The same applies to apparatus and venue names. Normalisation should not become an obsession: excessive fragmentation can make a small system difficult to use. Appropriate complexity depends on size and the people maintaining it.
One-to-many relationships appear naturally. A session contains attempts, a carry attempt may contain split times, and one implement appears across many sessions. A Medley involving distinct objects introduces an intermediate stage table. This supports comparison of specific stages without manually reconstructing the course from text notes. Structure follows the sport's real logic rather than the convenience of one report.
Referential integrity prevents attempts from pointing to nonexistent sessions. If attempt A900 references session S999 and that session does not exist, the system can reject or flag it. Spreadsheets may use lookup formulas or validation, while SQL systems use foreign keys. Technologies differ but the principle is the same: results must link to a meaningful context.
Not every attribute needs its own table. One short fatigue note can remain text. Regular monitoring of temperature, sleep and perceived effort across athletes may justify dedicated structures. Separate information when it has an independent identity, repeats frequently or requires distinct relationships. Without such criteria, architecture becomes an exercise in technical decoration.
A custom application may be justified once several athletes enter data simultaneously and the workflow needs approvals, videos and automated reporting. Complex software cannot repair vague definitions, however. If users disagree on what finishing time means, perfect database relationships will simply preserve a perfectly structured contradiction. Establish methods before code.
17. The CSV example: exchanging data without losing meaning
CSV is a text format used to exchange tables among applications. It supports exporting training records from one system and importing them into another without total dependence on the original interface. But CSV does not automatically preserve table relationships, data types or dictionary rules. A complete archive may need multiple files and field descriptions. One giant export can be convenient but may lose information about implements and sessions.
An educational example could use the header attempt_id,session_id,event_code,load_kg,distance_m,duration_s,status. One row might be A001,S001,YOKE,300,20,18.3,completed and another A002,S001,FARMERS_WALK,240,20,21.4,completed. In the latter, load_kg means total mass of two handles, and that convention must be documented. Otherwise a reader may interpret the athlete as carrying 240 kilograms in each hand. These are hypothetical records, not observations from real training.
For Farmer’s, separating load_per_hand_kg and total_load_kg is often preferable. A generic CSV spanning different event families may contain fields that are inapplicable to certain rows, requiring documented transformation rules. Importing without them can introduce systematic errors. In practice, specialised underlying tables plus an aggregated analysis export may offer a useful balance.
Field delimiters and decimal separators create familiar problems. Some files use commas between columns and dots for decimals, while regional software settings expect semicolons and decimal commas. The value 21,4 can be split incorrectly or read as text. Before importing a large archive, test a small sample and verify columns, units and durations. A few minutes of checking can prevent a damaged training history.
Character encoding matters as well. Romanian exercise names and athlete names containing diacritics should survive export. UTF-8 offers a useful international standard. Identifiers must also remain text rather than be converted into numbers that lose leading zeroes. An ID such as A001 should not become A1 when it is used for relationships.
CSV is useful for interchange but does not replace data protection. Files can be copied, modified and circulated accidentally, so personal information requires appropriate safeguards. Preserve the dictionary, schema version and export date alongside the data. A future reader should be able to interpret the archive without relying on its creator's memory.
18. Automated validation: what a table can check without a coach
Quality checks can begin with simple logic. Negative distance is impossible for an ordinary recorded course result, and zero seconds cannot describe a completed twenty-metre carry. If status equals completed, final time should be positive and completed distance should match the defined task. If status is not_started, there should be no official completion time. Such checks can be implemented in a spreadsheet or database before any statistical analysis.
Rules need context. Zero valid repetitions may be legitimate for an unsuccessful attempt, while negative counts are not. A hundred-second Farmer’s time may appear unusually slow but could arise from uncommon rules or multiple drops. It should not automatically be rejected because it exceeds an arbitrary threshold. Some checks can block logical impossibilities; others should request human confirmation.
Relational validation can verify that athlete_id, session_id and implement_id exist in their source tables. Duplicate attempt IDs need attention, but identical times are not sufficient evidence that two attempts are duplicates. Importing a contest twice may be detected through source codes and attempt identifiers. Deduplicating on load and time alone risks deleting real performances.
Mathematical checks help with derived fields. If non-overlapping split sections cover the complete course and use the same temporal reference, their sum should approximately match total time. Rounding and start definitions may explain differences, so tolerances need justification. Total load can be recalculated from implement and added masses. When derived values disagree, investigation should precede correction.
Short exception reports can flag completed attempts missing time, unknown loads, duplicate identifiers, impossible values or large changes from previous tests. These are not judgements about athletes; they identify observations needing contextual review. An unusual value may be a legitimate extraordinary record, which the system should preserve when confirmed rather than assume it is erroneous.
Automation helps only when rules are explainable. Algorithms silently deleting observations labelled unusual can distort analysis. Preserve original values, correction reasons and the person approving changes. In a sport involving unconventional equipment and genuinely extreme results, controlled flexibility is preferable to arbitrary rigidity. Validation should increase trust, not force reality to match software's assumptions.
19. Provenance and audit: where did each number originate?
A result may originate from manual timing, video, an official referee sheet or an application. These sources are not equivalent and may disagree. Databases should retain measurement_source, measurement_method and, where possible, a reference file identifier. When a time is corrected after video review, the system can explain why the final value differs from the initial note. Without provenance, auditing becomes guesswork.
Official data determine standings but may not be the best source for every biomechanical variable. A referee may confirm total time, while standardised video supports split calculations. Both can belong to one attempt and be stored separately. When they differ by a few tenths, the timing protocols must be understood before choosing a reference. Video is not universally more accurate than official timing.
A reliability note can describe known limitations: uncalibrated apparatus, difficult camera angle, unclear start signal or organiser-declared mass. These issues do not automatically invalidate an observation; they guide its appropriate use. A result with substantial uncertainty may be adequate for historical documentation but unsuitable for detecting a 0.2-second improvement. Confidence must be judged relative to the purpose of analysis.
Change history should retain old and new values, reasons and correction dates for important edits. Large systems can use audit tables; spreadsheets may begin with notes and version history. Silent overwriting is especially problematic once numbers appear in reports. Correcting a historical record can require reviewing conclusions that previously depended on it.
Provenance supports reproducibility. A future analyst should be able to reconstruct which observations and formulas produced a chart. Preserving raw files, dictionary versions and processing procedures makes results easier to verify. The FAIR principles for scientific data emphasise findability, appropriate accessibility, interoperability and reusability without requiring indiscriminate publication of private information.
Not every project needs elaborate auditing infrastructure. One athlete may simply preserve video and annotate corrected figures. Teams with several users need more systematic roles and version controls. The foundational rule is unchanged: every important number should remain traceable to a real observation and an identifiable method.
20. Computing indicators: clear formulas, not magical numbers
A database becomes analytical when useful indicators can be derived from sound observations. For a completed course, average speed equals distance divided by elapsed time. For a repetition set, simplified tonnage is load multiplied by repetitions, with previously discussed limitations. For a training week, total Yoke distance may be the sum of actual metres travelled. Each formula has an application domain and must be visible or documented; its name cannot substitute for a definition.
Consider a hypothetical Farmer’s attempt covering twenty metres in sixteen seconds. Average speed is 1.25 metres per second. If timing includes picking up the implements, this is the ratio of distance to the entire official interval, not pure walking speed. If the athlete drops the handles, the mean also includes stopping time. Reporting the value is legitimate; claiming constant movement at 1.25 metres per second is not. Summary numbers cannot reconstruct complete movement dynamics.
Four five-metre splits offer more information. If the first section takes 5.2 seconds and the last takes 4.0, the distribution is uneven. However, when pickup is included in the first section, the difference does not establish poor acceleration capacity. The phases must be defined before interpreting the mechanism. Segment speeds can be calculated automatically, but technical interpretation requires the timing protocol and movement context.
Percentage change is useful: the difference between new and old values divided by the old value, multiplied by one hundred. Lower race time represents improvement, whereas higher maximal load usually does. Reports must explain the favourable direction of each indicator rather than assume users will interpret the signs correctly. When the original value is zero or missing, the usual percentage formula is undefined.
Execution speed, power and other mechanical variables require suitable measurement. Truck mass cannot simply be transformed into pulling force because we know vehicle tonnage and course time. Similarly, horizontally transported mass does not automatically define mechanical work. Databases should separate mathematical identities from biomechanical estimates requiring sensors and additional assumptions. That distinction protects the credibility of analysis.
A new indicator is worth keeping only if it adds useful perspective. Multiple variables telling nearly the same story can clutter reports. Begin with raw outcomes and a few transparent calculations. More complex models may be explored after reliability is established. Data Lab expects formulas to be explainable to athletes who do not code, with conclusions proportionate to real measurement quality.
21. Progress charts: what to display and what not to conceal
Charts are useful when they reduce interpretation effort. Time against date can illustrate progress in a standardised test. Load and repetition charts describe training distribution. Split-time graphs identify sections where pace changes. Dozens of overlapping diagrams are unnecessary. A good visualisation answers one question and supplies enough context for readers to understand the result.
Axes need correct units. Farmer’s time belongs in seconds, not under an ambiguous label such as velocity. Average speed belongs in metres per second. Each series should contain sufficiently comparable outcomes. Mixing ten- and twenty-metre carries or per-hand and total loading can generate false impressions. Colours should not conceal protocol differences, and legends must explain each series.
Individual observations should remain visible when datasets are small. Trend lines can help but may suggest continuous development between two isolated tests. Moving averages smooth variation, yet the chosen window influences the pattern. No smoothing method is universally correct. Four observations with contextual notes may be more honest than an elaborate curve presented as proof of adaptation.
Charts should also communicate uncertainty. Manual timing with unknown error does not justify interpreting hundredths of a second. Where measurement-error estimates exist, suitable uncertainty displays may help. Otherwise, legends can describe the method and limitations. Small visual differences may matter competitively but should not be declared definitive without adequate evidence. Attractive graphics do not justify stronger claims than the collection process supports.
A minimal athlete dashboard may contain the latest standardised test, its recent history, volume by event family and short notes concerning fatigue or technique. Team coaches may need filters by athlete and event. Educational examples on a public website should clearly identify hypothetical data. Publishing a chart without such context can falsely imply that a real study was conducted.
Visualisations can reveal mistakes too. A load suddenly twice the usual value may indicate total Farmer’s mass entered into a per-hand field. Negative times and shifted dates may become obvious. Charts serve as an additional quality check, followed by inspection of the original record before correction.
22. Subjective data and health: useful without excessive surveillance
Sleep, fatigue, discomfort and mental readiness can influence how strength is expressed. A log may briefly capture these aspects while distinguishing sporting observations from sensitive medical information. A field for perceived energy before training can help interpret a session. Detailed medical histories and treatment records should not automatically enter a team-wide database simply because an application offers extra fields.
Subjective responses need consistency. If fatigue is rated from one to five, the dictionary should define both extremes. Changing later to a zero-to-ten scale without documenting the transition creates discontinuity. Athletes should know that observations support discussion and adaptation rather than character judgements. Without trust, self-reporting can become strategic and lose its practical value.
Wearables can provide pulse and heart-rate-variability data, but interpretation depends on method, measurement timing, medications, stress, sleep and sensor quality. Recovery scores cannot certify the safety of maximal Deadlift, and isolated values do not diagnose overtraining. Chest pain, confusion, collapse or other serious symptoms require appropriate medical assessment regardless of dashboard appearance.
Data Lab uses recovery information to observe individual trends. Repeated associations between increased workload, fatigue and poorer performance may justify programme review. They do not establish one causal mechanism. Sleep, nutrition, occupational demands and stress may overlap. Responsible interpretation maintains awareness of these possibilities instead of treating one graph as a complete explanation.
Collection should remain minimal and proportionate. Routine storage of exact live locations, personal conversations or unrelated private information has no automatic place in training monitoring. Medical data may require separate permissions and suitable protection. Teams can distinguish personnel allowed to view individual notes from those receiving only aggregated indicators. Monitoring technology should not become a pressure mechanism.
Athletes should be able to explain an unusual score without disclosing intimate details. Poor sleep can be recorded without documenting private life. Injuries require appropriate professional judgement about return to training, not an improvised algorithm. The database supports continuity and memory while remaining secondary to the athlete, coach and relevant professionals.
23. Weekly and seasonal trends: beyond today's personal record
Strongman is often represented through maximal records, but preparation develops across many ordinary sessions. Longitudinal databases reveal event frequency, intensity distribution and the development of standardised tests. One Yoke observation in a month offers less evidence about progress than several comparable observations. Yet increasing maximal testing frequency solely to collect data can compromise recovery. Sporting preparation should remain the priority.
Separate histories can be created for exercise families. Deadlift may be followed through loads, repetitions and sometimes velocity; Farmer’s through distances and times; Atlas through loaded objects and platform height; Log through accepted attempts. One combined tonnage line would mix mechanically different activities. Separate profiles better support identification of meaningful weaknesses and event priorities.
Weekly distribution needs training-phase context. Off-season may prioritise hypertrophy and volume with fewer maximal simulations. Closer to competition, specificity increases and volume may decline. Tonnage-only analysis could interpret a taper as regression when its aim is reducing fatigue. A training_phase field and period objectives help explain these deliberate changes.
Consider a hypothetical athlete repeating the same straight twenty-metre Farmer’s test at 120 kilograms per hand at three points within a training cycle. Times are 23.2, 22.0 and 21.1 seconds. This suggests encouraging change if methods and conditions match, but does not prove one particular programme component caused it. Familiarisation, rest, fatigue and technique may also contribute. Data support hypotheses rather than guaranteed causal explanations.
Competition outcomes vary with implements and rules, so they should remain distinguishable from standardised tests. A lower ranking against stronger opponents does not necessarily represent reduced capacity. Athletes may improve raw times yet place lower because rivals improve more. Databases can link raw outcomes and points without conflating them, providing a more balanced sporting evaluation.
Monthly analysis should yield a few actionable conclusions: which event is improving, where progress has stalled, which test needs repetition and which measurement became non-comparable. A twenty-page report without clear decisions has limited practical value. Monitoring should organise sporting experience rather than create administrative work without benefit.
24. A dashboard that informs decisions rather than replacing them
A dashboard is an interface through which collected information becomes accessible. It should display the metrics relevant to users rather than every stored field. Athletes may want Log and Farmer’s progress, coaches may need weekly workload distribution, and organisers may focus on official contest results. These views can draw on the same database without making every user become a statistical analyst.
A minimal strongman dashboard could show the latest comparable test, its recent history, workload summaries by event family, invalid attempts and fatigue notes. Not everything needs compression into one overall score. Improvement in Farmer’s alongside stagnation in Atlas suggests different training priorities; averaging the two would conceal the problem. Data should remain sufficiently disaggregated to support event-specific interventions.
Filters are essential. Users should select athlete, period, event, load and protocol. A Farmer’s timing chart mixing ten- and forty-metre courses without explanation is not useful for monitoring progress. Comparability filters can show only equivalent routes or display explicit warnings when conditions differ. Refusing an unjustified comparison is better than producing a colourful but misleading chart.
Dashboards should provide access to source records. An unusual time can link to the attempt, video, ground note or timing source where available and appropriately permitted. Aggregates without traceability become difficult to correct. A clear path from chart to original observation supports auditability and user confidence.
Recovery indicators require caution. HRV values and commercial readiness scores cannot certify fitness for maximal lifting. Sharp pain or other concerning symptoms take priority over a green dashboard symbol. The interface can prompt discussion but cannot replace medical assessment or responsible technical decisions. Uncritical automation of high-stakes decisions creates risk.
Good design remains restrained. Units are visible, dates accurate, legends clear and raw figures accessible. Distorted axes should not exaggerate progress. A concise periodic report may offer more value than a page filled with animation. The ultimate objective is a better choice for the next session, not a presentation that impresses but cannot be explained.
25. Hypothetical case study: eight weeks in a strongman's training log
Consider a hypothetical competitor preparing Farmer’s over twenty metres, Yoke over twenty metres and Log for repetitions. In week one, a standardised Farmer’s test at 120 kilograms per hand takes 23.6 seconds; Yoke at 300 kilograms takes 19.4 seconds; Log at 90 kilograms produces six accepted repetitions in sixty seconds. Records enter attempt tables together with implements, surface, time limit and timing method. All figures are invented for education and do not describe a real athlete.
During later weeks, the athlete completes ordinary volume and technical sessions. They do not test every event maximally each week because doing so could compromise preparation. The database preserves actual loads, repetitions, distances and perceived effort, while standardised assessments occur at manageable intervals. This makes it possible to examine training between tests without treating every workout as a personal-record attempt. Programme records and test outcomes are linked but remain distinguishable.
In week four, Farmer’s is completed in 22.4 seconds, Yoke in 18.9 and Log produces seven accepted repetitions. The differences look encouraging, but interpretation begins by checking equipment, timing and conditions. Suppose video reveals that the Farmer’s course was accidentally shortened by one metre. The result should not enter the strictly comparable series. It remains in the historical log with a protocol note. This demonstrates data-quality control rather than an attempt to hide an outcome.
In week eight, testing is repeated under the original conditions. Farmer’s reaches 21.7 seconds, Yoke 17.8 and Log eight validated repetitions. We can calculate time reductions and added repetitions. We cannot conclude that one specific exercise caused all changes because training included multiple components and there was no controlled comparison. We can say observed performance improved during the monitored period, subject to measurement reliability.
Split analysis hypothetically suggests that Farmer’s gained more time during the first segment than the last. Video appears to show a more efficient pickup, but this remains a technical interpretation rather than proof of a physiological mechanism. The coach may retain pickup-focused work and continue to examine the final segment. Database information has supported a more specific training question; it has not automatically selected the training programme.
The case demonstrates why raw records, conditions and unusual attempts must be preserved. Keeping only week-one and week-eight records would lose information about the shortened course, training distribution and evolving technique. Combining all events into one score would hide differences between them. Good databases do not generate absolute certainty, but support more defensible and useful conclusions.
26. Data reliability: tests need adequate repeatability
Before treating a small difference as progress, we need to know how much a result varies when underlying athletic capacity is relatively stable. Sports-measurement research by Hopkins and by Atkinson and Nevill describes random error, systematic changes and interpretation of repeated tests. These principles transfer to strongman, but numerical estimates must be investigated for each event and method. A coefficient of variation from running cannot simply be declared the reliability of Farmer’s.
Familiarisation may be needed before assessment. First attempts with an unfamiliar Yoke may change rapidly because of technical learning rather than capacity. Using those trials to estimate reliability risks confusing learning effects with instrument error. Protocols may include familiarisation followed by comparable observations without imposing repeated maximal tests under unsafe conditions. Suitable testing frequency depends on purpose and resources.
Consider hypothetical standardised Farmer’s times of 20.0, 19.8, 20.1, 20.2 and 19.9 seconds. Variation appears small, but timing error cannot be fully separated from biological and technical fluctuation. A subsequent 19.9-second attempt cannot be called certain progress. Repeated substantially faster results would offer stronger evidence, still requiring consideration of conditions.
Reliability does not guarantee validity. A course mistakenly believed to be twenty metres might actually be eighteen. Timing may be highly consistent while calculated speeds are based on the wrong distance. Similarly, wrongly labelled implements can produce repeatable yet inaccurate loading values. Equipment checks, landmark definitions and rules documentation are needed alongside statistical analysis.
Where adequate data exist, databases can store estimated measurement error by test protocol. Reports can then show appropriate uncertainty or flag changes too small for confident interpretation. Universal thresholds should not be invented, and unnecessary decimal places avoided. If reliability information is absent, reports should say so rather than hide uncertainty.
Reliable tests become useful references rather than permanent testing obligations. Athletes may repeat standardised Farmer’s at suitable intervals while reserving other sessions for development. Unusual results warrant checking footage and context before deciding whether retesting is appropriate. This protects preparation from impulsive decisions based on one number.
27. Backups, migration and long-term continuity
A training database gains value because it covers years rather than weeks. Keeping the entire history in one phone file creates a single point of failure. Regular backups stored separately and occasionally tested through restoration reduce the risk. Cloud synchronisation should not simply be assumed to work; check that a copy opens and preserves all tables. Video may require separate arrangements because of file size.
A simple plan can include periodic CSV exports and a complete copy of the native file alongside its dictionary and schema version. When using an application, verify whether exports preserve relationships among sessions, attempts and implements. Some tools provide only summaries or chart images, insufficient for reconstructing original records. The ability to leave a service without losing data is a major practical feature, not a minor technical concern.
Before migrating to another system, test representative cases: a maximal Deadlift, Farmer’s with splits, an incomplete Medley and an attempt with missing values. Successfully importing these reduces uncertainty. Migrating only neat records hides problems that often emerge in unusual cases. Identifiers and units must survive, and record counts should be compared before and after the transfer.
Schema versioning supports evolution. An early load_kg field may later need separation into load_per_hand_kg and total_load_kg. Migration rules must document how historical values were transformed and which entries remain ambiguous. Values should never be invented retrospectively. Records that cannot be converted confidently can remain in a distinct historical category with appropriate warnings.
Teams need clear responsibilities for database administration, entry, corrections and full-history exports. Access should reflect necessity, particularly when personal observations and videos are stored. Coaches may need training-relevant information without automatically gaining access to sensitive medical details. Proper permissions contribute to athletes' trust in monitoring.
Continuity does not mean keeping every datum forever. Retention should reflect purpose, consent and applicable rules. Public competition results may justify different periods from sensitive recovery notes. Decisions should be explainable rather than rely on indefinite accumulation. A good database remains usable, recoverable and responsibly maintained.
28. Privacy and ethics: an athlete is more than a statistical profile
Training records may contain ordinary performance information alongside observations about sleep, pain, medication or health conditions. The latter can be sensitive and require additional safeguards. Professional databases collect only information relevant to declared purposes, define access and do not assume that agreement to train means permission to publish every metric. Athletes should understand when footage and results are used internally and when publication is proposed.
Consent and lawful basis for processing are not always identical, and responsibilities vary with context and applicable law. Within the European Union, GDPR principles include purpose limitation, data minimisation, security and individual rights. Health data may have additional requirements. This article describes general principles rather than legal advice. Organisations storing sensitive information should review their specific obligations.
Video deserves separate treatment from numerical outcomes. Other athletes, referees and spectators can appear in footage, while online distribution introduces a purpose beyond internal technical assessment. Permission to record for coaching does not automatically authorise commercial publication. Systems can link to access-controlled media rather than expose every recording to all users. Protecting access does not prevent responsible analytical use.
Records can become biased when athletes fear the consequences of reporting difficulty. If high fatigue ratings lead to ridicule or criticism, entries may become less honest. Team culture therefore affects monitoring validity. Coaches should use observations as tools for conversation and programme adjustment rather than evidence of poor character. No score replaces discussion of the athlete's actual context.
Statistical models built on small datasets can unfairly label competitors as injury-prone or poor at recovering. Such claims have personal consequences and may exceed the available evidence. Algorithms developed on other athletes cannot issue definitive clinical judgements. Particular caution is required when results affect selection, reputation or opportunities. Data are tools for understanding, not sentences passed on people.
Ethics includes the freedom not to turn every workout into a measurement exercise. Athletes sometimes need sessions focused on technique or recovery rather than collecting every possible metric. Systems that consume excessive attention can become counterproductive. Respect for performance also means respect for the person producing it. Sound monitoring should support autonomy, clarity and cooperation.
29. A thirty-day implementation: from an empty file to a usable log
A useful database can begin without special purchases. During week one, define goals, choose two or three priority events and create a dictionary covering field names, units and rules. Set up session, attempt and implement sheets, then enter fictitious observations to test the structure. Importing years of historical results immediately is unwise because older units and protocols may be inconsistent. First verify that the model can represent one complete workout, a failed attempt and a timed carry accurately.
In week two, use the system during actual training without changing the programme merely for data collection. After each session, enter essential information within a few minutes: apparatus, load, repetitions, distance and outcome, along with meaningful conditions. If entry becomes burdensome, simplify the interface. A system athletes cannot use consistently after demanding workouts is impractical regardless of its theoretical elegance.
During week three, check errors: duplicate codes, incorrect units, missing completion times and sessions assigned to wrong dates. Add simple formulas such as average course speed and valid-repetition totals. Complex prediction models are unjustified on a handful of observations. If split times are desired, test video analysis and confirm that event landmarks can be identified sufficiently well. Metrics that cannot be reproduced need revision.
In week four, produce the first report. It may answer which activities were actually completed, which loads were used, how many attempts counted and which test deserves standardised repetition. Athlete and coach then discuss whether any information improved a decision. Fields routinely left blank without consequence can become optional. Important missing context can be added through a clearly defined new field.
Before involving additional athletes, document responsibilities, access permissions and correction procedures. Establish backups and test a complete export. Long-term systems should record schema versions. Implementing SQL, mobile applications and predictive models simultaneously is unnecessary. The priority is a small understandable and verifiable dataset that can grow without silently changing its past.
This thirty-day schedule is an educational suggestion, not a scientifically validated intervention or mandatory deadline. Some teams need more time, while others can create the foundation in a day. The meaningful success criterion is functional: important observations can be found, explained and used to support better decisions. Technical development should adapt to sporting needs, not the other way round.
30. Ten mistakes that undermine a promising training database
The first mistake is collecting without a question, producing many fields and few complete records. The second is missing definitions, allowing one load field to mean per-hand mass one day and total mass another. The third is confusing planned with actual work. The fourth is mixing official records and estimates. Clear dictionaries and entity separation prevent these problems without expensive technology.
The fifth mistake is ignoring implements and surfaces. A Yoke time with one adjustable frame is not automatically equivalent to a result with another apparatus at the same mass. The sixth is replacing missing values with zero, potentially distorting averages and speed calculations. The seventh is applying formulas without checking physical units, such as assuming mass multiplied by horizontal Farmer’s distance equals mechanical work. Mathematical complexity does not compensate for incorrect mechanics.
The eighth is retaining only successful attempts. Removing failed trials can exaggerate consistency. The ninth is lacking backups and usable exports, leaving history vulnerable to loss. The tenth is treating commercial or statistical scores as judgements about health and capacity. Reports can suggest questions but cannot replace individual evaluation or appropriate medical attention when concerning symptoms arise.
A further cross-cutting risk is failing to verify imported data. Even well-designed tables can be damaged by decimal separators, reversed dates or identifiers converted into numbers. Every migration needs a manually checked sample and record-count comparison. Silent assumptions are inappropriate. If original information cannot be recovered, document the uncertainty instead of concealing it.
Excessively complicated systems can fail even when software works perfectly because users stop entering data. Strongman sessions are long, event demands diverse and competitions busy. Entry should be short enough to remain realistic. Photographs and videos may support interpretation, but not every attempt needs dozens of indicators. Tools should conserve athletic attention rather than consume it.
These mistakes share one cause: numbers become the purpose rather than the means. Good databases can be corrected, explained and simplified. They acknowledge uncertainty without drama. When apparatus identity or timing protocol is unknown, the honest answer is that it is unknown. Such restraint is more valuable than comparisons that are precise only in appearance.
31. Conclusion: the database as a verifiable memory of performance
Building a strongman training database begins not with choosing an application but with defining performance and the questions that matter. A lift needs an implement, load, rules and outcome. A moving event needs distance, surface, timing and attempt status. A training cycle needs context, workload, observations and chronology. When these elements are distinguished and correctly related, past preparation becomes easier to understand rather than a collection of isolated numbers.
The greatest gain is not an impressive chart. It is the ability to retrieve an attempt two years later and explain what happened, what was measured and what remains uncertain. A poorly defined history can contain ten thousand rows yet provide little reliable information. A modest database with stable identifiers, clear units and preserved sources may support much better coaching decisions. Method comes before data volume.
Progress requires disciplined interpretation. Faster Farmer’s times and heavier Log lifts are encouraging under sufficiently comparable conditions. Where apparatus, course or technique changes, outcomes need context. Tonnage is not a universal equivalent of stress, and estimates are not official records. Mature systems accommodate unknown values and documented corrections instead of manufacturing certainty.
Data also have a human dimension. Athletes are more than recovery scores, and algorithms should not replace coaching judgement. Self-reporting may be useful where trust exists, video can strengthen technical observation and tables can reveal trends, but every source has limits. Responsible databases protect personal information and support decisions made with athletes. Sustainable performance requires rigour and respect for the individual.
The next episode will examine the relationship between one-repetition maximum and dynamic events using the architecture developed here. We can compare maximal lifting records with Yoke and Farmer’s outcomes while discussing correlations, confounding variables and prediction limits. Without well-defined data, such analysis is speculation; with coherent records, it becomes possible to formulate questions worth testing. This is where Strongman Data Lab begins to take shape.
A strongman athlete may remember the record of a particular day and the emotion of a final repetition. A carefully built database preserves conditions, failed attempts, tactical decisions and improvements that never appear in a viral clip. It does not remove the spectacle of the sport; it adds memory and verifiability. Instead of asking only how much was lifted, we can ask under which conditions, by what method, and what was learned for the next event. That is the foundation of genuinely useful performance monitoring.
Selected scientific references
[1] Hindle, B. R., Lorimer, A., Winwood, P., & Keogh, J. W. L. (2019). The Biomechanics and Applications of Strongman Exercises: A Systematic Review. Sports Medicine - Open, 5, 49. https://doi.org/10.1186/s40798-019-0222-z
[2] Hindle, B. R., Lorimer, A., Winwood, P., Brimm, D., & Keogh, J. W. L. (2021). The Biomechanical Characteristics of the Strongman Yoke Walk. Frontiers in Sports and Active Living, 3, 670297. https://doi.org/10.3389/fspor.2021.670297
[3] Winwood, P. W., Cronin, J. B., Brown, S. R., & Keogh, J. W. L. (2014). A Biomechanical Analysis of the Farmers Walk, and Comparison with the Deadlift and Unloaded Walk. International Journal of Sports Science & Coaching, 9(5), 1127–1143. https://doi.org/10.1260/1747-9541.9.5.1127
[4] McGill, S. M., McDermott, A., & Fenwick, C. M. J. (2009). Comparison of Different Strongman Events: Trunk Muscle Activation and Lumbar Spine Motion, Load, and Stiffness. Journal of Strength and Conditioning Research, 23(4), 1148–1161. https://doi.org/10.1519/JSC.0b013e318198f8f7
[5] Hindle, B. R., Lorimer, A., Winwood, P., & Keogh, J. W. L. (2020). A Systematic Review of the Biomechanical Research Methods Used in Strongman Studies. Sports Biomechanics, 19(1), 90–119. https://doi.org/10.1080/14763141.2019.1598480
[6] Hopkins, W. G. (2000). Measures of Reliability in Sports Medicine and Science. Sports Medicine, 30(1), 1–15. https://doi.org/10.2165/00007256-200030010-00001
[7] Atkinson, G., & Nevill, A. M. (1998). Statistical Methods for Assessing Measurement Error (Reliability) in Variables Relevant to Sports Medicine. Sports Medicine, 26(4), 217–238. https://doi.org/10.2165/00007256-199826040-00002
[8] Foster, C., Florhaug, J. A., Franklin, J., et al. (2001). A New Approach to Monitoring Exercise Training. Journal of Strength and Conditioning Research, 15(1), 109–115. PubMed: https://pubmed.ncbi.nlm.nih.gov/11708692/
[9] Saw, A. E., Main, L. C., & Gastin, P. B. (2016). Monitoring the Athlete Training Response: Subjective Self-Reported Measures Trump Commonly Used Objective Measures: A Systematic Review. British Journal of Sports Medicine, 50(5), 281–291. https://doi.org/10.1136/bjsports-2015-094758
[10] Soligard, T., Schwellnus, M., Alonso, J. M., et al. (2016). How Much Is Too Much? (Part 1) International Olympic Committee Consensus Statement on Load in Sport and Risk of Injury. British Journal of Sports Medicine, 50(17), 1030–1041. https://doi.org/10.1136/bjsports-2016-096581
[11] Wilkinson, M. D., Dumontier, M., Aalbersberg, I. J. J., et al. (2016). The FAIR Guiding Principles for Scientific Data Management and Stewardship. Scientific Data, 3, 160018. https://doi.org/10.1038/sdata.2016.18
[12] Bland, J. M., & Altman, D. G. (1986). Statistical Methods for Assessing Agreement Between Two Methods of Clinical Measurement. The Lancet, 327(8476), 307–310. https://doi.org/10.1016/S0140-6736(86)90837-8
[13] Koo, T. K., & Li, M. Y. (2016). A Guideline of Selecting and Reporting Intraclass Correlation Coefficients for Reliability Research. Journal of Chiropractic Medicine, 15(2), 155–163. https://doi.org/10.1016/j.jcm.2016.02.012
[14] European Parliament and Council of the European Union. (2016). Regulation (EU) 2016/679 (General Data Protection Regulation). Official Journal of the European Union, L119, 1–88. https://eur-lex.europa.eu/eli/reg/2016/679/oj
More From The Journal

Training
The Science of Strongman Training - Episode X: Competition Programming
How to build a complete Strongman competition preparation block: calendar, events, volume, intensity, specificity, simulations, autoregulation, tapering and fatigue management.
Training
The Science of Strongman Training - Episode IX: Peaking
Peaking in Strongman: how to turn months of training into maximal competition performance by reducing fatigue, preserving adaptations and managing specificity.