
Training Science
Series: STRONGMAN DATA LAB: HOW WE MEASURE AND ANALYSE PERFORMANCE - Episode 1: What Does Measurable Performance Mean in Strongman?
October 15, 2026
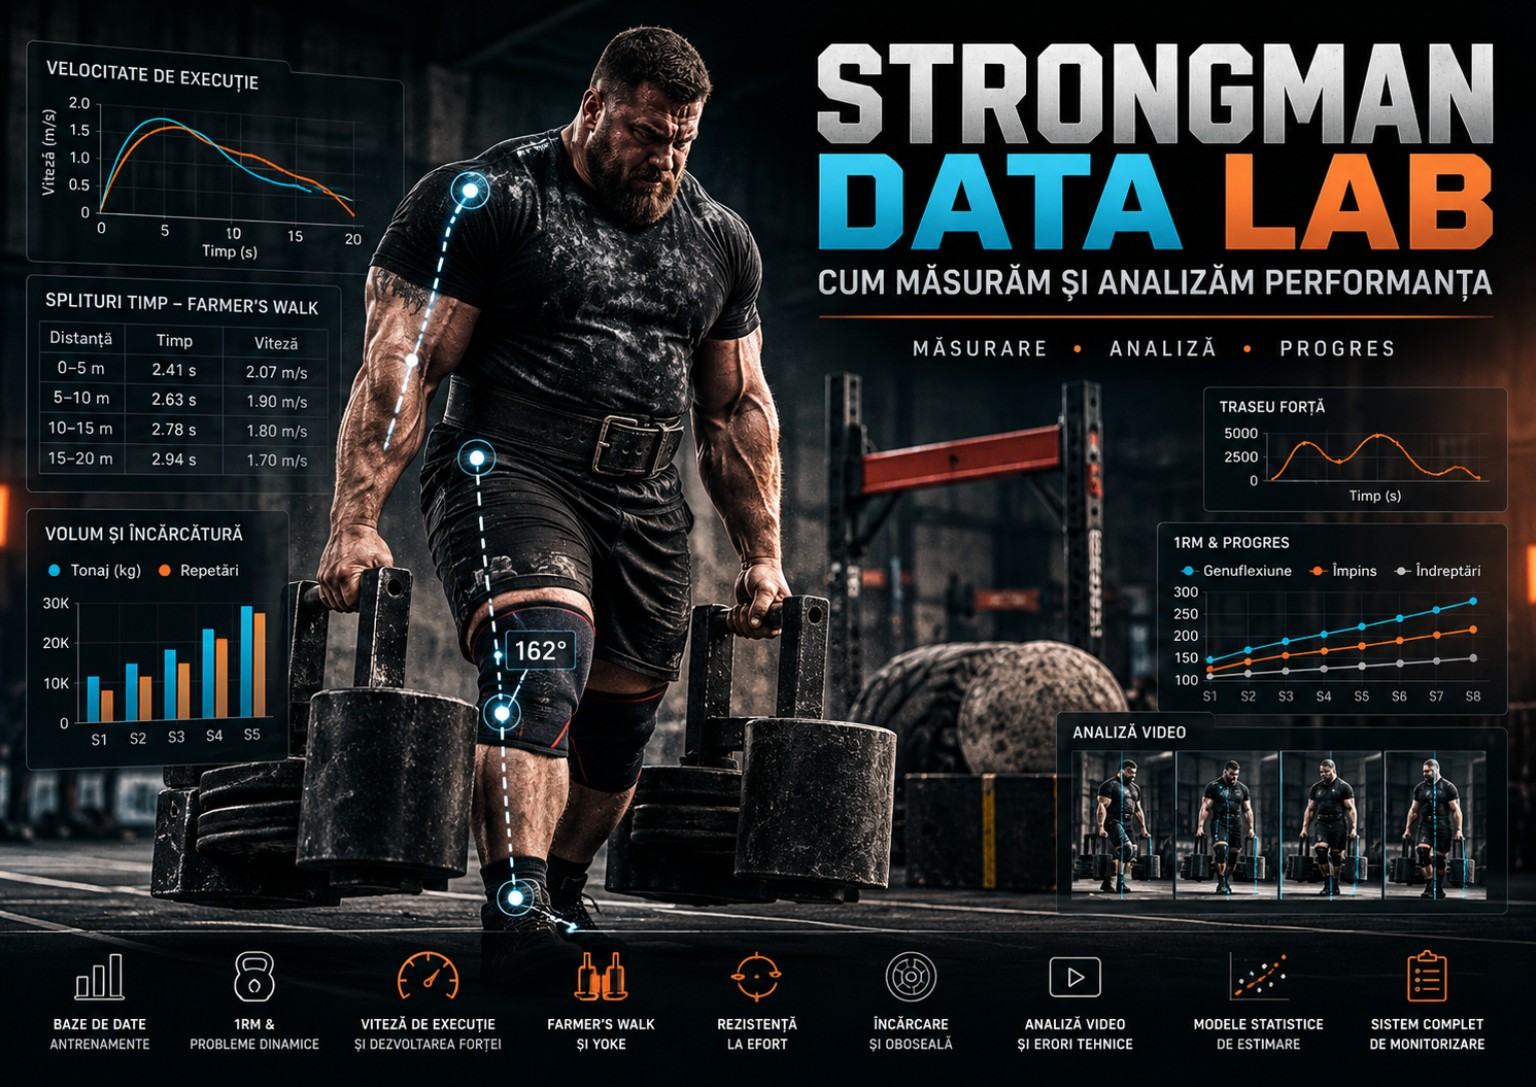
Strongman has a complicated relationship with numbers. Implements appear objective: two hundred kilograms, twenty metres, sixty seconds. Yet an athlete may win an event without being the strongest in an ordinary one-dimensional sense, and apparently identical outcomes may conceal very different demands. A twenty-second Farmer’s Walk does not describe the load, surface, timing protocol, number of drops or changes in speed. A maximal Deadlift does not automatically predict a Truck Pull result. The question opening the STRONGMAN DATA LAB series is therefore more important than it first appears: what does measurable performance actually mean in strongman?
A superficial answer would be to record as many numbers as possible. Scientific practice begins the other way round: define the capacity of interest, the conditions in which it is observed and the confidence that can be placed in the measurement. Course time is an outcome. Maximal force, acceleration, technical efficiency, fatigue tolerance and competitive strategy are dimensions that can influence that outcome. Some can be measured directly with appropriate equipment, others estimated, and some remain difficult to separate with the available evidence. Distinguishing observations from indicators and interpretations is the foundation of this series.
We will examine strongman as a performance system rather than a collection of personal records. An athlete generates force, transfers it through an implement, interacts with the ground and performs a task defined by competition rules. Altering any component can change the outcome without the athlete’s muscles suddenly becoming stronger or weaker. A Yoke with a different bar height, Farmer’s handles with different diameters, a differently sized Log or an added course turn changes the task. Data that omit such details may look numerically precise while supporting misleading conclusions.
This first episode establishes the language and tools used in the following nine. We explain results versus capacities, validity versus reliability, and real improvement versus measurement variation. We develop numerical examples for Farmer’s Walk, Yoke Walk, Log Lift, Deadlift, Truck Pull and repetition events; examine the limitations of estimated one-repetition maxima and velocity sensors; and explain how attempts can be compared and why aggregated scores require transparent rules. Basic equations, a collection protocol and practical decision examples are included. Illustrative numerical values are identified as hypothetical rather than falsely presented as observations from actual athletes.
The scientific foundation includes biomechanics research conducted directly with strongman athletes, studies of Yoke and Farmer’s Walk, and broader literature concerning performance testing, training-load monitoring and load–velocity relationships. Available studies do not support every popular training rule, and strongman samples are often small. We will not turn correlation into causation or claim that a watch, phone application or video camera reveals absolute truth. For each meaningful metric, the questions remain the same: what does it measure, with what error, under which conditions, and for which decision?
The series pursues a practical goal: a reproducible approach to understanding progress for athletes, coaches, organisers and interested readers. Data should not replace experience, but improve the discipline with which it is interpreted. An athlete may have a valuable intuition that a Yoke run feels unstable; sound measurement can help determine whether the difficulty reflects the start, speed, fatigue or the ground. Ultimately, measurable performance should not mean more charts for decoration. It should mean fewer decisions based on fragile assumptions.
1. Why a number is not automatically a good measurement
Sporting performance is often reduced to a visible outcome: lifted load, elapsed time or the number of accepted repetitions. These figures matter because competition rules turn them into points, but they do not always represent an athlete’s underlying physiological capacity. A contest assesses task completion under particular circumstances rather than a pure property called strength. The distinction is fundamental for coaches. Losing two seconds in Farmer’s because of an unusual turn does not prove reduced grip strength. Lifting a heavier Log through improved technique is genuine progress, but cannot automatically be attributed to muscle hypertrophy.
In scientific methodology, a construct is the characteristic we seek to describe: maximal strength, power, acceleration capacity, local endurance or technical skill. The observed variable is the recorded figure: kilograms, seconds, metres per second or repetitions. The relationship between them is a hypothesis requiring justification. A twenty-metre time can reflect acceleration, maximum speed, turning efficiency and resistance to deceleration. An aggregate result does not show which component changed. If the coaching question concerns the start, at least the first split needs measurement rather than only the finish time.
Performance must also be distinguished from capacity. Capacity describes available potential, whereas observed performance is influenced by technique, motivation, discomfort, environment and rules. An athlete may possess excellent maximal strength yet transfer it poorly to an awkward implement. Another may record outstanding times under moderate loads but lose that advantage under very heavy conditions. Neither observation cancels the other. Strongman calls for multidimensional interpretation, with indicators selected around specific competitive tasks instead of a universal strength score.
A hypothetical example illustrates the problem. Athlete A carries two 110-kilogram handles over twenty metres in 18.5 seconds on dry asphalt without a turn. Athlete B records 19.1 seconds with the same load but a 180-degree turn. A has the faster raw time, but we cannot conclude that A is faster in equivalent conditions. Turning adds braking, pivoting and secondary acceleration. Sound analysis requires standardised routes or explicit reporting of differences. Stopwatch precision cannot correct an invalid comparison.
An operational definition specifies exactly what is being measured. Farmer’s time might run from the official signal until both implements cross the finish, including drops and stops. Another protocol might begin with the first movement or end when the athlete's torso crosses the line. Each can be internally consistent, but their results should not be mixed. For Log Lift, an accepted repetition depends on referee commands and lockout standards rather than merely reaching a particular height. Definitions turn scattered observations into a shared language.
The foundational rule of Strongman Data Lab is that each number needs a name, unit, protocol, context and decision purpose. If we cannot explain why a value is being collected or which choice it informs, the measurement may not yet be necessary. Technology can produce abundant figures with impressive decimal places, but decimals do not compensate for vague definitions. Rigour begins when we can answer a simple question: what would actually need to change in the real world for this number to change?
2. Strongman is a system of events, not a single physical quality
Powerlifting combines three lifts governed by comparatively stable rules, although equipment and officiating variations still matter. Strongman uses a much wider range of implements and tasks: Log, Axle, Deadlift, Yoke, Farmer’s, Stones, Sandbags, Truck Pull and many others. Some contests reward maximal weight, others repetitions under time limits or races over fixed distances. Performance cannot therefore be reduced to one strength test. A database following only squat, bench and deadlift will provide an incomplete picture of an athlete whose competitive strengths lie in moving events.
Events can be grouped by outcome: maximal-load tasks, repetition tasks, timed carries, pulling or pushing events and mixed challenges. This is a practical classification rather than an exhaustive biomechanical truth. Yoke and Farmer’s are both races, yet they distribute loading, grip demand and stability requirements differently. One maximal Atlas Stone differs from loading five stones onto successive platforms. Records should preserve the event family and the precise implementation of the task, rather than treating each event name as a complete technical description.
Raw scores answer different questions across event families. Kilograms describe a legally completed lift under specified conditions. Repetition count records accepted movement cycles within a defined time and load. A carry time records task completion over a stated distance, course and set of implements. Average velocity comes from distance divided by time, but it may conceal pauses and short periods of rapid acceleration. Comparing competitors requires first establishing that the task was meaningfully equivalent.
Biomechanical research provides support for this diversity. McGill and colleagues examined spinal movement and trunk activity across strongman tasks, highlighting distinctive loading patterns. Winwood and colleagues demonstrated characteristics of the Farmer’s Walk that differ from unloaded walking. Hindle and colleagues described spatiotemporal and kinematic variables in Yoke Walk in 2021. These studies have sample and design limitations and do not define a universal model of performance. They do, however, justify event-specific indicators rather than a single number claiming to represent everything.
A useful framework separates at least four layers: physical capacities, technical execution, task demands and official outcomes. Hip-extension force belongs in the first; gait and implement path in the second; mass, distance and surface in the third; time, repetitions and points in the fourth. Storing everything in a column called performance destroys our ability to reason about mechanisms. Clear links between layers permit better questions even when measurement tools are inexpensive or relatively simple.
Strategy must not be forgotten. An athlete may stop a repetition event once enough work has been completed to win and conserve energy for the remainder of the contest. The same athlete might achieve more repetitions in training. The official result describes what occurred under scoring rules, not necessarily the maximum physical capacity available at that instant. Recording the reason for stopping, where known, prevents naive interpretations. Measurable strongman remains a sport shaped by decisions, not an automatic machine producing numbers.
3. What is directly measured, calculated and merely estimated
The first methodological distinction is between direct measurement and derived indicators. Implement mass can be checked with a calibrated scale, time recorded through timing equipment, and object position tracked with calibrated video. Average speed is then calculated from distance and time. Mechanical power can be estimated when relevant force and velocity in the same direction are known, but these quantities do not automatically follow from a stopwatch. A calculated number is not inherently false; its assumptions must simply be described.
A basic example: twenty metres completed in ten seconds corresponds to an average speed of 2.0 metres per second. This is a mathematical identity, not proof that the athlete travelled at precisely that speed at every instant. They may have accelerated slowly and later reached 3.0 metres per second, or experienced a brief stop. Split times or continuous motion tracking can reveal more of the dynamics. Even then, instrument resolution and the quality of position identification constrain accuracy.
Force presents additional complications. Implement mass in kilograms is not force in newtons; gravitational weight can be approximated by multiplying mass by gravitational acceleration. Actual forces involved in a moving Yoke include dynamic components, while loading on the athlete depends on acceleration and ground contact. Calling the apparatus mass the force produced by the athlete would therefore be incorrect. Estimating ground-reaction forces requires appropriate instruments, such as force platforms, and a consistent measurement protocol.
Likewise, joint torque cannot be read accurately from a single angle in a photograph. Angles provide kinematic information, but estimating joint moments requires additional data, anthropometric assumptions and biomechanical models. An application drawing a line across the knee may help with visual comparisons when recordings are repeatable. It does not automatically reveal precise ligament loading. Video-based observations can guide questions, but should not be confused with a validated kinetic analysis.
Estimation is valuable when direct measurement is too risky or costly. We can estimate one-repetition maximum from a submaximal set or follow a lift's velocity trend with an appropriate sensor. These methods contain errors and assumptions; accuracy depends on exercise, athlete and procedure. A formula investigated primarily with straight-bar lifts cannot automatically be assumed valid for Log, Stone or Sandbag. An estimated value should be labelled as such instead of placed in the same column as an official record.
An honest measurement system preserves data provenance. Official and video-derived times can coexist when labelled, while directly tested and estimated one-repetition maxima can be followed separately. Chart lines should only be compared when methods are sufficiently homogeneous. A change of method requires explicit annotation. Without such discipline, apparent performance jumps may come from changing instruments or equations rather than training adaptations.
4. Validity: does the instrument answer the right question?
Validity concerns the extent to which evidence supports an interpretation of data for its intended purpose. A test can be highly repeatable yet measure something different from what the coach needs. A grip dynamometer may provide consistent values without reproducing the support of heavy Farmer’s handles during movement. An unloaded sprint measures rapid body motion without a carried implement; it may offer useful information but cannot replace a loaded Yoke run. Validity must be evaluated relative to a decision, not granted permanently to a device.
Several validity questions are relevant. Does the test represent the task adequately? Does its outcome relate to other meaningful measures? Can it distinguish athletes with known differences in performance? Does it respond to training changes? These questions are not interchangeable. A correlation between Deadlift and Farmer’s results may suggest a relationship, but cannot establish that increasing Deadlift directly causes a faster carry. Mechanisms, research design and confounding factors still matter.
For coaches, ecological validity concerns the similarity between the test and actual competition demands. A twenty-metre Farmer’s trial with comparable loading and handles is more specific to that event than an arbitrary static grip test. Nevertheless, extreme specificity may reduce comparability with other competitions using different implements or surfaces. Two levels of assessment can therefore be helpful: a standardised gym test for monitoring and an event-specific rehearsal for tactical preparation.
Bar velocity during a squat offers another example. It can reveal aspects of repetition quality and performance fluctuation within that exercise. But the speed of a straight bar does not directly determine the launch speed of a Log. Centre of mass, movement path, technique and geometry can differ substantially. When a sensor has been validated on particular exercises, extension to unusual strongman implements should be investigated rather than assumed. Every metric has a justified domain of application.
Competition rules also shape validity. If one contest permits repeated contact with the ground during a carry while another penalises or stops the attempt, finishing times describe different tasks. If the lockout standard for Log changes, repetition counts can vary without any alteration in physical capacity. Tests intended to monitor progress need stable rules. Historical records should annotate differences rather than using a smooth chart to mix judging conventions with athletic adaptation.
There is no single most valid test for every question. Measurement is appropriate when it contributes useful information to an explicit decision. If the issue is acceleration over the first five metres of Yoke, timing that segment is more relevant than hand dynamometry. If the issue is grip tolerance, a safe and specific grip test may help. As questions change, instruments can change too, provided the new values are not mixed uncritically with older data that measure a different phenomenon.
5. Reliability and error: how much can the same athlete vary?
Reliability concerns measurement consistency when attempting to observe the same characteristic in sufficiently similar conditions. Differences across standardised trials may reflect actual performance variation, instrument error or inconsistent procedures. A manually timed result includes an operator's reaction; a camera may have an inadequate frame rate; an application may detect the finishing line incorrectly. Measurement variability should not be confused with training adaptation. Every serious test needs an estimate of its own uncertainty rather than an assumption that the recorded digits are exact.
Repeated indicators can be described using standard deviation, coefficient of variation or typical error, provided their meanings and assumptions are understood. Coefficient of variation expresses dispersion relative to the mean and can support certain comparisons, but is not appropriate for every variable or distribution. Minimal detectable change reflects the principle that a difference must be sufficiently large to exceed a defined portion of measurement uncertainty. Such statistics should not be calculated from two casual observations and then proclaimed universal characteristics of the event.
Consider hypothetical standardised Farmer’s times of 19.8, 20.1, 19.9, 20.2 and 20.0 seconds, observed under comparable conditions on separate occasions. The mean is 20.0 seconds, with relatively little observed variation. Recording 19.9 seconds the next week would not justify announcing an unquestionably improved athlete. Consistent subsequent times around 18.7–18.9 seconds would make genuine improvement more plausible. These values illustrate reasoning; they do not define a validated strongman reliability threshold.
Error can be random or systematic. One operator starting the clock on first movement and another at the referee signal may introduce a fairly stable difference. Their averages then diverge even if each person performs consistently. If an application calculates distance incorrectly, derived speeds can all be biased in the same direction. Repeating a flawed procedure does not make it accurate. High reliability is not a guarantee of validity or absolute precision.
Standardisation reduces avoidable variation through the same measured distance, verified load, comparable warm-up, footwear, ground conditions and timing definitions. It does not require every gym session to occur under a laboratory dome. Rather, inevitable variation is documented and controllable variation is minimised. Rain during a test should be recorded, and the result may need separation from dry-ground records. Quality documentation can matter more than expensive equipment.
Strongman Data Lab will not label a 0.5% improvement certain when measurement error is unknown. We should report uncertainty, not only percentage change. For modest practical decisions, a repeated pattern may be sufficient without elaborate statistics. Scientific claims comparing training programmes require more rigorous designs and appropriate samples. Across contexts, the strength of the conclusion should be proportionate to the quality of evidence.
6. Sensitivity to change: when a difference matters in sport
A test may be reliable without being sensitive enough for the intended purpose. A stopwatch displaying only whole seconds can conceal a 0.4-second improvement. If a contest separates athletes by hundredths, an unsuitable instrument misses meaningful differences. Conversely, a highly sensitive sensor may detect tiny variations that never affect competitive outcomes. We must distinguish statistically observable change, change exceeding instrument error and change that matters practically in sport.
For timed events, meaningful differences depend on the competitive level. Half a second may separate podium positions in a short Farmer’s race, while in another context it matters little. During training, improvement across the first five metres may indicate a useful adaptation even if total time remains similar because later fatigue has increased. One overall result can conceal important technical change. Indicator selection depends on the smallest difference likely to influence a decision.
For maximal-load events, available increments constrain test resolution. If the gym provides only five-kilogram changes, an athlete cannot demonstrate a one-kilogram improvement through that test even if physiological adaptation exists. Furthermore, increasing an 80-kilogram Log by five kilograms is relatively different from adding five to an 180-kilogram Log. Percentage reporting provides context but does not replace competition standards or the athlete's level.
Performance-monitoring literature sometimes discusses the smallest worthwhile change, defined relative to the application's purpose. There is no universal number for every sport, and establishing one can be difficult. A practical approach asks how much a race time needs to improve to affect likely standings, how many extra repetitions matter at the official load, or how much better Yoke acceleration must become to change the final result. This moves analysis from context-free figures towards relevant decisions.
Learning effects also matter. Early attempts with an unfamiliar implement may improve quickly through technique even without substantial new muscular adaptation. After familiarisation, progress can be slower. Comparing the first and third Sandbag Carry sessions does not reveal the same information about strength as comparing sessions after several months of consistent experience. Establishing familiarity is sometimes necessary before reliability can be assessed meaningfully.
Good monitoring therefore defines meaningful differences before examining the results. Changing thresholds after seeing the data creates a temptation to select the most flattering story. Small effects may matter, but require cautious interpretation. A coach can decide to repeat an unusual test before redesigning a programme. This is not distrust of the athlete; it is respect for measurement complexity.
7. Standardisation: comparison begins before the lift
Evaluating progress requires understanding how comparable two tests really are. A sound protocol identifies load, implement dimensions, course length, surface, equipment, event order and the timing definition. It also records factors potentially altering the result: temperature, rest intervals, recent sleep, pain, warm-up and reason for stopping. Not every variable needs a statistical model. Many are simply necessary to avoid drawing false conclusions from a retrospective performance chart.
Consider a hypothetical Yoke example. In week one, an athlete carries 300 kilograms over twenty metres with a frame whose bar sits 145 centimetres high. In week four, they carry 320 kilograms, but using another frame at 135 centimetres on firmer ground. Have they grown stronger? Possibly, but the load comparison alone does not prove it. Apparatus geometry and walking conditions can alter mechanics. A useful assessment would repeat the original standardised trial or explicitly document the differences.
Farmer’s standardisation begins when the handles leave the ground. Some contests begin timing at the starting signal, others when the handles are completely lifted. If time includes the pick, improving that phase may produce a faster result without changing loaded walking speed. If timing starts after the pick, the metric describes a different task. Load should also be stated unambiguously as per-hand or total mass. A field named load_per_hand_kg avoids confusion that can otherwise be substantial.
Deadlift records should include bar type, starting height, straps, equipment, lockout standard and other relevant details. A Rack Pull starting several centimetres above the floor does not automatically translate into an equivalent conventional Deadlift maximum. Relationships between partial and complete movements depend on the athlete and their limiting range. Applying an invented coefficient to convert a partial lift into a full-range one-repetition maximum produces impressive-looking mathematics without adequate validation.
Standardisation should remain practical. Few athletes can access force platforms or climate-controlled laboratories. Most can measure the same twenty metres, use consistent timing equipment, check implement mass where possible and record conditions in a few fields. A carefully maintained spreadsheet can outperform a sophisticated electronic system that ignores surfaces and rule changes. Reproducibility begins with procedural discipline rather than budget.
When conditions inevitably change, contextualised comparison remains possible. Results from external competitions provide valuable historical and ranking information without automatically becoming standardised tests of physiological progress. Notes such as rain, turn included, different handles, pickup included or rule changed may prevent months of mistaken conclusions. A few descriptive words can sometimes be more useful than another decimal place.
8. Building a test record: few fields, many answers
An effective testing record begins by identifying the attempt: athlete, date, location, event variation and purpose. Then come the fields without which the result cannot be interpreted: load, unit, distance or time limit, rules and outcome. Moving events also require surface, turns and drops. Maximal lifts require attempts and their validity, while repetition events need load, duration and the relevant technical standard. Environmental or symptom observations belong in separate fields rather than being hidden inside an ambiguous numerical score.
Unique session identification prevents confusion. Where two sessions occur on the same day, time and a session code may help. An athlete may perform Farmer’s with two different loads; each attempt should be a separate record linked to the common session. Training outcomes must not be confused with official records. A session_type field could distinguish training, standardised test, simulation and competition. Simple classification then enables useful filtering without mixing events performed for different purposes.
Missing values require honesty. If the exact mass of a competition implement is unknown, we should not automatically record the advertised number as independently verified. The announced mass may be retained with its source identified and a lower certainty label. When timing comes from video review, the method is documented. If footwear was not recorded, the value remains unknown. Retrospectively filling missing fields through guesses can create more error than leaving them empty.
A useful example could read: standardised test, twenty metres, Farmer’s at 120 kilograms per hand, dry asphalt, straight course, pickup included, video timing at 120 frames per second, 21.4 seconds, no drops, slow acceleration in the first five metres. This is a hypothetical record, not an actual athlete's result. It permits future comparisons and suggests a coaching question. By contrast, a notebook line saying Farmer’s 120, good is too ambiguous for serious analysis.
Data-quality rules can improve the record. Negative completion times, zero distance paired with positive speed, or pounds entered into a kilograms field should be flagged. Such controls do not require artificial intelligence; ordinary spreadsheet validation is sufficient. Preserving raw numbers is equally important. If software later computes an index, the underlying measurements should remain available for checking and recalculation.
A useful database develops gradually. Initial fields reflect decisions that need to be made now, while new variables are introduced when their purpose is clear. Fifty incomplete indicators are less valuable than ten consistently defined ones. At the end of a month, athletes can ask whether collected information actually changed their training plan. If not, the problem may not be a shortage of charts. It may be that the original question was forgotten.
9. Fundamental measures: load, distance, time and repetitions
Mass is one of the most accessible strongman variables, but it requires care. Farmer’s load may refer to each handle or both together, and Yoke figures must specify whether the frame is included. Unusual Deadlift apparatus may weigh differently from their advertised values. Units need to be explicit, with implements weighed where practical. An organiser's declared load is valid information about the rules but not necessarily an independently verified measurement. Both types of value can be stored if they are labelled differently.
Distance should be measured rather than estimated from steps or gym dimensions. A nominal twenty-metre moving event may include a turn, and the starting line might be defined by the apparatus or the athlete's body. These details can alter the mechanical distance travelled. Carrying until the complete implement crosses a finish line may require greater movement than the nominal course length. Records should describe markings, not merely contain the text twenty metres.
Timing similarly depends on rules. Photocell systems start and stop on beam crossings, while manual timing depends on an operator's reactions. Video permits frame-by-frame review but still needs clear event definitions. Two systems can be compared before one is adopted as the standard training reference. Official competition times and training times may come from different procedures, but they should not be mixed as if they were methodologically identical.
Counting repetitions is deceptively complicated. A repetition may be rejected for incomplete lockout, instability or failing to follow a referee command. In a medley, moving to the next implement may count only once an object is correctly placed. If an athlete performs ten attempts and only eight are accepted, the official result is eight while technical analysis may record all ten. Distinguishing attempts from validated repetitions helps describe performance and the actual workload experienced.
Derived measures include average speed, split time, repetition rate and a simplified sum of load handled. Average speed equals distance divided by time when both variables are defined appropriately. By contrast, tonnage calculated as mass multiplied by repetitions is not itself mechanical work or physiological stress. Two sessions with identical tonnage may involve different ranges of motion, speeds and levels of exertion. A convenient calculation should be named as what it is: a simplified descriptive indicator.
Basic measurements are not inferior to sophisticated ones. Accurate histories of loads, distances, times and repetitions often reveal patterns that expensive sensors cannot rescue from incomplete records. Faster completion under identical conditions is useful evidence of progress. Where conditions differ, improved time cannot automatically be attributed to one mechanism. Fundamental numbers begin the reasoning process; they do not finish it.
10. Calculating moving-event speed: what it reveals and conceals
For travel over a known distance, average speed equals distance divided by total time. If a twenty-metre Farmer’s Walk takes sixteen seconds, calculated average speed is 1.25 metres per second. But this figure does not describe the pickup, acceleration, maximum speed or pauses. Under very heavy loads, getting the implements off the ground may consume a meaningful part of the official time. Including pickup means that calculated average speed combines a stationary lifting phase with the actual walking phase.
Analysis improves when the course is divided into four five-metre segments. Consider hypothetical times of 4.2, 3.5, 3.7 and 4.6 seconds, totalling 16.0 seconds. Segment average speeds are approximately 1.19, 1.43, 1.35 and 1.09 metres per second. The pattern suggests initial acceleration followed by slowing near the finish. It does not establish whether the slowdown reflects grip fatigue, stability, breathing or the surface. Explaining causes requires additional observations rather than another calculation from the same four numbers.
A slow final segment may suggest work on resisting speed decline, but only after checking whether the course includes a turn or intentional braking before the finish. If the final five metres include planned deceleration, comparison with the middle segment does not represent fatigue alone. Numerical analysis requires biomechanical context. Two runs with identical completion times can have different distributions: one with a rapid start and severe slowdown, another with a stable pace. Those patterns may justify different interventions.
Average acceleration can be approximated from change in velocity divided by elapsed time, but estimates become sensitive to noise when speeds come from short sections. Differentiating position to obtain velocity, then velocity to obtain acceleration, amplifies tracking errors. A noisy curve is not automatically evidence of violent real accelerations. Software often applies smoothing filters, with outcomes influenced by their settings. Comparing curves therefore requires consistent processing and clear reporting of methods.
Practically, runs can be divided into pickup, acceleration, stable movement, turn and finish phases. Not every course contains every phase. A ten-metre event may be dominated by pickup and acceleration, whereas forty metres may place more emphasis on maintaining speed and grip. The indicators most relevant to outcomes can therefore change with distance. An athlete fast over ten metres is not necessarily the winner over forty. Training should reflect the target task rather than abstract maximum speed alone.
A useful report may include official time, average speed and four split times alongside load and course description. In a standardised test, that can reveal whether improvement primarily concerns pickup, early movement or maintaining pace. There is no need to invent a variable called neural efficiency merely because spreadsheet columns are available. Every added indicator should address a distinct practical question.
11. Lifting velocity: useful but not universally transferable
Velocity monitoring in resistance exercise has become popular through linear transducers, optical systems and video applications. It can inform concentric speed, load–velocity profiles and changes during a set. Velocity-based training literature provides useful applied frameworks, but outcomes depend on exercise, equipment and procedure. In strongman, where implements have unusual geometry and variable movement paths, interpretation demands more caution than simply reading a number on a phone.
Mean concentric velocity describes displacement within a defined interval, whereas mean propulsive velocity uses a more specific definition of the phase of interest. Values should not be mixed without method documentation. Peak velocity can differ substantially from repetition average and can be sensitive to noise or the chosen start and end points. Software algorithm changes may affect historical comparability. A value displayed as 0.62 metres per second is meaningful only when its underlying movement definition is known.
Tracking a Log is more complicated than tracking a straight bar because the implement rotates during the clean and changes position relative to the athlete. Following the visible centre of a Log does not guarantee measurement of its centre of mass or each body segment's contribution. Axle and Deadlift may be simpler, but technique, lockout and accessory differences remain relevant. Measurement devices need validation for the task or explicit use as exploratory indicators rather than established truth.
Suppose first-repetition speed at an identical load increases consistently across a training cycle. That may suggest improved ability to move the load, but it does not by itself prove an increased one-repetition maximum. Changes in movement depth, range, intention or camera angle can alter the result. Some repetitions are intentionally performed at different speeds for technical reasons. Protocol consistency is essential for interpretation.
Load–velocity relationships can estimate maximal strength, yet systematic reviews show that prediction accuracy varies among exercises, instruments and modelling methods. No universal minimum one-repetition-maximum velocity applies automatically to every strongman competitor, style and implement. Importing thresholds from other athletes can produce incorrect estimates. Individual profiles may be more informative, but require quality measurements and periodic verification.
Practical use can begin modestly: follow one standardised movement with the same device, technique and several reproducible loads. If data prove consistent and useful, the approach may expand. If an instrument cannot track the implement reliably, interpretation should not be forced. Strongman Data Lab treats velocity as a potentially valuable tool rather than a magical formula making every preparation problem transparent.
12. Force, power and mechanical work are not synonyms
In gym conversation, force, power and energy are often used interchangeably. In mechanics, they describe different quantities. Force is expressed in newtons and can accelerate or support a load. Mechanical work involves force acting through displacement in its direction. Power describes the rate at which work is done, such as work divided by elapsed time. Athletes may produce high force at low speed or high power with another force–velocity combination. These qualities are related but not identical.
For an object lifted vertically through height h, an educational approximation of work against gravity is W = m × g × h, neglecting other contributions. Raising a 100-kilogram object by one metre represents approximately 981 joules of gravitational work. This does not mean the athlete's total metabolic energy expenditure is 981 joules. The body also uses energy for stabilisation, internal contractions, posture and many other processes, and efficiency is not perfect. The equation describes one specific component of external mechanical demand.
During Farmer’s Walk, implements may travel horizontally at approximately constant height. The simple formula for vertical gravitational work does not describe the total cost of locomotion, which involves centre-of-mass movement, acceleration, oscillation and muscular effort. Calculating mass multiplied by gravity multiplied by horizontal distance and calling the result required walking work confuses vertical force with horizontal displacement. Advanced analyses need relevant force and velocity components rather than the automatic multiplication of available numbers.
In Truck Pull, properly measured and synchronised horizontal force and displacement speed could permit estimates of external power. Vehicle mass, however, is not the force needed for motion. Rolling resistance, slope, friction and acceleration all matter. Dividing truck mass by finishing time does not generate a valid power measurement. Every formula should identify what was measured and which simplifications were introduced.
Yoke produces high vertical loading and potentially important horizontal accelerations. Force platforms and biomechanical systems may provide additional information, but estimating internal spinal or joint loading requires models and assumptions. A sensor attached to an implement does not automatically reveal every force within the body. An impressive graph with force on its vertical axis is inadequate unless units, sensor placement and calculation methods are explained.
The purpose is not to turn every coach into a mechanical engineer. It is to remove confusions that produce false recommendations. Tonnage should be labelled a simplified accounting measure, velocity requires a defined distance and time, and claimed power needs a defensible method. Sometimes saying that a quantity cannot be estimated from the available data is more scientific than publishing a four-decimal number without physical meaning.
13. The relationship between 1RM and dynamic events: correlation, not destiny
Maximal strength is a major strongman resource, but one one-repetition maximum cannot describe the whole athlete. A large Deadlift may help with Farmer’s pickup or some loading tasks, yet carry speed also depends on gait, stability, grip endurance, implement geometry and the ability to sustain output. Two athletes with identical Deadlift records can have very different Yoke times. Relationships between maximal capacity and event outcomes require empirical investigation rather than assumptions drawn from broad statements about strength.
With an appropriate dataset, one could calculate correlation between Deadlift one-repetition maximum and event completion time. A negative coefficient might indicate that athletes with stronger Deadlifts tend to finish faster, provided they perform comparable tasks. Body mass, experience, division and participant selection may influence the result. Statistical association does not prove that increasing one individual's Deadlift by a given amount will reduce their time by an exact number of seconds. Causal conclusions require other research designs and justified assumptions.
Relative strength introduces additional problems. Dividing one-repetition maximum by body weight yields a simple ratio, but it is not universally the correct scaling method for every task. During Truck Pull, body mass and traction may interact differently from Log Lift. Cross-division comparisons require attention to allometry and event regulations. A 140-kilogram athlete cannot be evaluated adequately through one simplistic percentage of body mass. The predictive ability of an indicator must be tested for the intended setting.
Transfer from gym lifting to competition is another issue. An athlete improving Deadlift from 250 to 270 kilograms may improve some events, but no equation automatically converts those twenty kilograms into two seconds gained in Farmer’s. If grip or turning technique was the limiting factor, transfer may be modest. If picking very heavy handles from the floor was the problem, improved hip extension may matter more. Interpretation should begin with the actual constraint.
Maximal testing also has a cost. Frequent all-out attempts can produce fatigue and risks that are difficult to justify solely for more data points. Submaximal estimates or standardised performance markers may offer alternatives, provided they are labelled accurately and interpreted with method-specific error. Near a championship, technical preparation and workload management may matter more than constant record checking. Measurement should not become another unnecessary overload stimulus.
One-repetition maximum should therefore remain an important element of a broader profile. Split times, repetition tolerance, between-attempt recovery and technical outcomes can sit alongside it. There is no need to force everything into one universal performance score. Sometimes a profile showing separate strengths and limitations is the most useful representation. Strongman rewards completing diverse tasks rather than one isolated maximum.
14. Pacing analysis in Farmer’s and Yoke: start, middle and finish
In moving events, average speed does not show how effort is distributed. One competitor may pick the implements quickly and then slow, while another begins more gradually and accelerates. Both patterns can yield the same total time. Segment analysis helps identify where time is gained or lost. It does not turn every fluctuation into a physiological explanation. A slow start may reflect cautious technique, a difficult pickup or a different timing signal rather than poor acceleration capacity alone.
Hindle and colleagues examined Yoke Walk biomechanics in experienced athletes using five-metre sections. Their work provides a direct precedent for interval analysis in strongman. The sample and protocol do not establish a universal optimal velocity for every competitor. Load, frame dimensions and technical background influence movement. Research results should generate coaching questions rather than become compulsory numerical targets copied from a study group.
Farmer’s analysis can distinguish pickup time, the first five metres and the remaining sections. If pickup consumes substantial time, technique improvement may matter more than increasing speed in the middle. If an athlete starts well but slows markedly after fifteen metres, grip tolerance, posture and movement economy become questions worth investigating. Yet one speed curve cannot distinguish every cause. Video observations and training history are needed to support plausible explanations.
Yoke oscillation may limit speed even when the athlete's legs could generate additional propulsion. Slightly shorter steps may be a deliberate strategy to control sway. An analysis rewarding stride length alone could therefore promote unsuitable technique. Indicators need interpretation within a system of stride frequency, length, stability, implement path and finishing time. A technical adjustment reducing oscillation while improving completion time is practically valuable.
Turns change analysis substantially. A twenty-metre course with a turnaround after ten metres should not be compared directly with a straight route. Braking and reacceleration time can be treated separately, but the beginning and end of the turn need an operational definition. Otherwise, results depend on analyst judgement. When competition includes turns, training should rehearse the specific demand without sacrificing safety around the knees or ground surface.
Split times become most valuable when they lead to clear interventions. A major loss during pickup suggests one problem; a slowdown in the final five metres suggests questions concerning pacing, endurance and stability. An isolated indicator may improve before overall time changes, which can still matter if it reduces risk or prepares for heavier loads. That interpretation must be explained. A graph is a tool for asking better questions rather than a referee of technique.
15. Repetitions under a time limit: measuring work tolerance
Repetition events are common in strongman, but final counts conceal how effort is distributed. An athlete completing eight Deadlift repetitions in sixty seconds may perform five rapidly before increasingly long pauses. Another may complete pairs at a steadier pace. The official score is identical, but strategies and limiting factors can differ. Timing individual repetitions during training may suggest whether the main issue is initial speed, repetition tolerance or technical deterioration.
To measure this, record when each repetition is validated or passes a clearly defined landmark. The interval between repetitions may include lowering, resetting the grip and voluntary rest. A slow repetition interval does not necessarily mean the concentric phase was slow; the athlete may simply spend longer preparing. If concentric velocity is the question, another indicator is required. If event pacing is the question, validated-repetition timing may be sufficient.
Consider an illustrative sixty-second event in which repetitions are completed at 6, 12, 19, 27, 36, 46 and 58 seconds. Intervals between accepted lifts progressively increase. That may reflect fatigue or deliberate pacing but does not establish one specific metabolic mechanism. Video can reveal whether completion time rises because lifts slow or because more preparation occurs between them. Training interventions should follow the actual limitation rather than the numerical pattern alone.
Attempted but rejected repetitions deserve a separate count. If ten lifts are attempted and only eight accepted, attempts describe total exposure better than the official result alone. Rejected repetitions also reveal technical issues such as incomplete lockout, instability or ignored commands. Analysis focused only on raw volume may overlook the valuable achievement of reducing wasted attempts. In awkward-object events, this technical efficiency can substantially influence the final placing.
Repetition tolerance depends on load and time limit. Two sets of eight are not equivalent when one uses 180 kilograms and the other 220. Eight repetitions within forty seconds also represent a different task from eight within ninety seconds. Every indicator should therefore include task load and temporal context. Repetition rate can be calculated, but may be misleading if pacing and rules are ignored. It does not replace assessment of execution.
Preparation can use reproducible submaximal protocols rather than repeated tests to failure. The aim is to observe adaptation without creating excessive fatigue solely to gather data. A test disrupting the next three training sessions may cost more than it reveals. Repeatability, safety and competitive relevance need to be considered together. Intelligent monitoring extends training rather than adding another unofficial competition every week.
16. Video: useful measurement or an illusion of precision?
Video is among the most accessible strongman tools because it permits review of pacing, body positions and accepted or rejected attempts. But a camera does not automatically convert three-dimensional movement into precise measurement. Angle, distance, lens perspective and obscured body segments influence results. Comparing trunk angles requires reasonably consistent placement and alignment with the plane of interest. Otherwise, apparently different joint positions may reflect camera geometry rather than real movement change.
Frame rate matters when analysing brief phases. At thirty frames per second, each frame represents approximately 0.033 seconds before event-detection error is considered. At 120 frames per second, the interval is approximately 0.0083 seconds. Greater temporal resolution can help when timing short events, but does not guarantee precision if the start and finish remain ambiguous. High-resolution footage with poor lighting or obscured implements may be less useful than simpler footage recorded from a suitable position.
Course markers make movement analysis easier. If five-metre lines are known and the camera clearly shows the same apparatus reference crossing each one, approximate split times can be obtained. Estimating distance from the relative size of objects without calibration can introduce major perspective error. Physical velocity requires trackable points and a defensible conversion between pixels and real space. Without that, software provides visual motion tracking rather than validated physical speed.
Technical analysis can be qualitative and rigorous at the same time. We can note that Yoke oscillation increases in the second half, a competitor becomes unstable during a turn, or Log path grows less consistent with fatigue. Assigning an exact angle or proprietary score to every observation is not obligatory. Preferably, observation criteria are defined before reviewing footage and similar attempts are compared. Agreement between observers can also be evaluated when subjective scoring is important.
The risk arises when video algorithms are presented as diagnoses. Pose-estimation applications may fail when large implements, loose clothing or obscured body parts interfere with detection. Estimated knee angles do not directly measure ligament stress, and a screen marker cannot replace medical assessment of pain. Models can provide valuable exploratory information, but they require validation for the task and population. Limitations become especially important when the decisions influenced by a metric are potentially risky.
A practical protocol involves fixing the camera, arranging good lighting, keeping position and distance consistent, marking timing references, preserving original footage and recording measurement definitions. The best camera view for timing may differ from that needed to analyse knee movement. Do not try to derive every metric from one unsuitable video. Data Lab treats footage as an additional window onto execution, not a device that converts assumptions into certainty.
17. Training load: volume, intensity and different contexts
Training-load monitoring begins by distinguishing what an athlete does from how the body responds. External load can include implement mass, distance, repetitions, duration and attempts. Internal load may be described through perceived exertion, fatigue, heart rate in suitable contexts or other physiological responses. These dimensions are not interchangeable. Two sessions involving the same total mass can have very different costs when one contains demanding repeated lifts and the other consists of easy technical practice. A useful system stores external task descriptors and athlete responses separately.
Tonnage, commonly calculated as mass multiplied by repetitions, is attractive because it creates one simple number. Across strongman implements, however, the sum can mislead. Ten Log repetitions do not describe the same task as ten Sandbag loads, and Yoke runs carrying 300 kilograms are not equivalent to Deadlift at the same nominal mass. Range of motion, duration, contraction type and stabilisation demands differ. Tonnage can track one standardised exercise across time, but a weekly total mixing every event needs careful interpretation.
Ratings of perceived exertion provide complementary information. Performing an equivalent task with consistently lower perceived difficulty may suggest useful adaptation when conditions are comparable. The rating scale must be defined and athletes familiarised with it. An RPE of eight for a heavy single does not describe the same construct as a global session rating of eight. Session-RPE methods should therefore remain distinct from estimates of repetitions in reserve or the difficulty of one attempt.
Strongman sessions vary in duration and density. Several heavy Log attempts may produce one pattern of strain, whereas Yoke, Farmer’s and Sled with short rests produce another. Weekly plans should describe event distribution and recovery opportunities rather than summing every kilogram handled. New pain or persistent performance reductions also require examination of sleep, food, work, travel and psychological stress. Attributing all fatigue to a tonnage figure is inadequate.
Acute-to-chronic workload ratios have attracted attention, but applying them without understanding statistical limitations can generate unreliable recommendations. One computed value cannot determine individual injury risk. Injuries arise through interactions among exposure, capacity, technique, environment and personal factors. Load-management consensus statements emphasise this multidimensionality. Data Lab treats load graphs as prompts for discussion and adjustment rather than automatic traffic lights declaring athletes fit or injured.
A realistic weekly log might record mass, distance or repetitions, sets, work duration, perceived exertion and a brief technical note for each event. Across several weeks, coaches can identify heavy-session distribution and recovery patterns. An adjustment that reduces needless fatigue without compromising performance is useful. No secret composite number is needed when two or three clear graphs and honest observations answer the practical questions.
18. Daily readiness and recovery: what indicators can tell us
One poor training result does not prove permanent strength loss. Insufficient sleep, accumulated fatigue, pain, temperature or gastrointestinal problems can alter the expression of capacity. Daily-readiness monitoring therefore sometimes concerns general condition rather than the event outcome itself. A brief questionnaire may cover sleep quality, perceived fatigue, unusual soreness and motivation. Such information is subjective but not necessarily useless. Consistent collection and comparison with personal patterns make interpretation more defensible.
Wearable devices can provide activity, heart-rate and estimated heart-rate-variability information. Values depend on body position, measurement time, temperature, stimulant exposure and sensor quality. There is no universal HRV threshold proving that a strongman can safely perform maximal Deadlift. A green graph cannot exclude injury, while an unusual reading does not automatically mean the nervous system is exhausted. Decisions need to reflect actual function and symptoms.
Standardised submaximal tests may provide neuromuscular-readiness information when reliability is established for the athlete and exercise. The speed of a familiar repetition can, for example, be compared with previous values without maximal attempts. However, changes in technique, equipment or measurement method weaken interpretation. One unusual result cannot establish a cause. It can suggest discussion, load adjustment or retesting after rest rather than a definitive conclusion.
Context also matters for athletes with work obligations outside training. Long travel, hours on the feet or fragmented sleep may influence an evening session. The log should not become constant surveillance of personal life. A few relevant categories chosen with athlete consent can explain variation without unnecessary intrusion. Monitoring should support training rather than collect unlimited sensitive information that has no effect on decisions.
Medical warning signs take priority over readiness scores. Chest pain, collapse, confusion, new neurological weakness or suspected acute injury require appropriate assessment rather than recalculating tonnage. An application cannot diagnose rhabdomyolysis or a torn tendon. In a sport involving extremely heavy loads, using a convenient score to disregard clear symptoms is dangerous. Recovery metrics are supplementary information, not medical clearance.
Over time, monitoring may reveal personal relationships between heavy-session sequences, needed rest and events associated with prolonged discomfort. These observations are hypotheses to be tested rather than universal laws. A coach may discover that changing event order or rest intervals works better than adding exercises. The value lies in improved decisions, not a more impressive dashboard.
19. Longitudinal progress: reading weeks instead of isolated records
Personal records are memorable, but not always the most informative points in a performance history. Outcomes fluctuate with preparation, fatigue, environment and daily motivation. Tracking only all-out attempts can miss steady improvements in submaximal speed or repetition tolerance. Longitudinal records allow standardised tests at reasonable intervals. The aim is not to test in every training session, but to gather enough comparable references to distinguish patterns from accidents.
Charts must display changing task conditions. When Farmer’s handle mass rises from 100 to 130 kilograms, completion time no longer reflects the same task and cannot be compared naively. Each load can be displayed separately, or a time–load profile examined when enough data exist. Distance, course or handle changes should also be labelled. Historical records remain valuable, but a continuous chart should not hide discontinuities in what was effectively tested.
Trends can be described with moving averages or simple models, but these choices matter: how many sessions are included, and how much variation is smoothed? Excessive smoothing can hide important changes while none may leave a very noisy picture. Retaining visible individual points alongside an explained trend is often preferable. Small datasets require modest conclusions. An upward line based on three attempts cannot prove that a programme will continue to work.
Consider hypothetical times across six weeks for a twenty-metre Farmer’s test at 120 kilograms per hand: 22.4, 21.9, 21.5 and 20.8 seconds. The apparent progression is consistent, but interpretation requires checking ground, timing and athlete condition. If comparable, the pattern is encouraging. If the final trial used a shorter course, the conclusion changes entirely. Data quality determines the strength of the story, never the other way round.
Tapers or lighter periods may temporarily improve results by reducing fatigue, without structural adaptation changing in the same proportion. This does not make the result unimportant; competition rewards what can be expressed when it matters. But future planning needs to distinguish developed capacity from fatigue-management effects. Models attributing every improvement to one exercise ignore sleep, recovery and the wider training schedule.
Good longitudinal analysis combines quantitative outcomes with log notes. A chart may show better acceleration while technical observations suggest a more efficient pickup. Numbers and athlete impressions will not always agree; disagreement is a reason to investigate rather than dismiss either source. The best result is not a dramatic collection of records, but a sufficiently clear picture to choose the next training cycle.
20. Comparing athletes: rankings require context
Comparing athletes is attractive because sport involves ranking. Yet an online personal record may come from a gym, an official event or a test with specific equipment. Without rules and implement details, declaring one athlete stronger than another can be difficult to justify. Official results are meaningful within their competitions but are not automatically equivalent across organisations. Strongman legitimately permits many variants of apparently similar events.
Individual event results are most defensibly compared among athletes performing the same task within one contest. Conditions are more similar there, although weather, surface and starting-order changes can still matter. Cross-competition comparison needs information on load, distance, implement dimensions and judging criteria. Even with those details, some conditions remain difficult to capture, making certain comparisons descriptive rather than definitive.
Weight divisions complicate evaluation. A strong lightweight result cannot simply be reduced to a proportion of body mass, and open-weight performance cannot always be judged by the same transformation. Allometric approaches can be useful in research but require choosing an exponent and target characteristic. No universally appropriate scaling method works automatically for Log, Yoke, Farmer’s and Truck Pull together. Scoring rules further influence the importance of each outcome.
Event profiles can be more useful than one average ranking. A competitor may excel at Yoke and Truck Pull but struggle with Stones, while another possesses a strong Log and modest moving-event results. Similar averages do not imply that they need identical training. Disaggregated data reveal different improvement opportunities. One composite strongman index may look convenient but conceal the weaknesses most relevant to planning.
Composite scoring requires weights. Equal points per event imply equal contributions to the final score under that competition's rules, not a universal law of athletic performance. Models using other weightings must explain their choices. Changing weights can reverse rankings, demonstrating that the index is an analytical construction rather than a natural property measured directly. The model should serve a clear purpose and not hide its assumptions.
Strongman Data Lab will use a hierarchy of comparison: identical standardised tasks first, similar tasks with explicit differences second, and exploratory comparisons with stated uncertainty last. Claims about records or programme superiority should display their criteria. Where information is insufficient, conclusions must be more modest. Respecting athletes includes refusing to turn non-comparable numbers into definitive judgements.
21. Statistics without magic: means, variation and predictions
Statistics describes regularity and uncertainty; it does not manufacture certainty from weak data. An arithmetic mean gives a centre of observations but can be influenced by extreme values. A median is the central ordered value and may be more robust in some situations. Standard deviation describes dispersion, while confidence intervals express uncertainty under defined assumptions. Strongman training datasets are often small, making it particularly important not to confuse additional decimal places with additional knowledge.
Imagine five Farmer’s times: 18.4, 18.6, 18.5, 18.7 and 24.0 seconds. The mean is 19.64 seconds, while the median is 18.6. The last attempt hypothetically included dropping an implement. Removing it without explanation hides a potentially relevant fact about grip or stability. Mixing it into the average without context may make usual performance seem slower than most attempts indicate. Showing individual observations, appropriate summaries and notes is more informative than relying on one statistic.
Regression can describe relationships between load and time or bar velocity and lifted mass. Yet extrapolation beyond observations may produce implausible values. If an athlete tested Farmer’s only at 80, 100 and 120 kilograms per hand, predicting performance at 180 is far more uncertain than estimating performance at 110. Relationships need not remain linear, and grip, fatigue and technique may change at heavy loads. A model fitted to a handful of points is not equivalent to demonstrated capacity.
Model assessment requires distinguishing data used for fitting from data used for verification. A model may describe previous sessions almost perfectly yet fail when predicting new ones, a problem known as overfitting. Datasets with one athlete and a few sessions rarely justify complicated models with many parameters. Sometimes comparing predictions against a simple benchmark, such as the last result under identical conditions, is more challenging than producing an elaborate chart.
Prediction errors should be expressed in interpretable units. A mean absolute timing error of 1.2 seconds has a direct practical meaning. An impressive coefficient of determination alone does not reveal whether errors are acceptable for deciding podium placings. Internal validation also does not guarantee transfer to different implements, surfaces or body-weight divisions. Predictive claims should remain limited to contexts supported by evidence.
Statistics can support coaching judgement without replacing it. It helps distinguish repeated patterns from exceptional observations, quantify uncertainty and test hypotheses. When a result looks spectacular, the first question should concern whether raw data and definitions are correct. A model cannot repair an incorrectly measured course, inconsistent timing or ambiguous loading field. Prediction quality begins with observation quality.
22. Missing data, unusual observations and database hygiene
A training database does not become useful merely by accumulating rows. Each field needs a meaning, collection time and understandable source. A missing value may indicate that a variable was never measured, a device failed or an event never took place. These situations are different. Automatically replacing every missing value with zero can dramatically distort averages and charts. Well-designed records distinguish actual zero, no observation and invalid attempts.
Unusual values need investigation rather than automatic deletion. An exceptionally slow run may reflect a dropped implement, timing mistake or injury. Each explanation has a different meaning. When the objective is uninterrupted carrying speed, analysing no-drop runs separately may be appropriate if the rule is disclosed. When predicting official results, removing all drops can produce an unrealistically optimistic picture. Data selection should follow the question rather than the answer someone hopes to obtain.
Units create mundane but serious errors. Pounds entered as kilograms can manufacture a dramatic apparent performance improvement. Some times may be entered as seconds and others as minutes and seconds, inviting misinterpretation. Metres and feet require explicit conversions. Robust systems use standard units and input validation. Conversions should remain traceable so that every figure can be explained if questioned.
Historical edits need documentation. Discovering that an implement weighed five kilograms less than previously believed may justify correction, but the change and its reason should be recorded. When a video-derived time replaces a manual figure, preserving both versions can be useful for audit. Silently deleting earlier values can compromise comparisons and trust. Even a simple spreadsheet can include source and correction-note fields.
Implement identity is essential in strongman. Two Yokes with equal total mass can differ in frame height and weight distribution, while Farmer’s handles vary in diameter and length. An implement identifier allows attempts to be linked with relevant characteristics. When the apparatus is unknown, that limitation should remain visible. Every component need not be measured to the millimetre, but details affecting comparability deserve preservation.
Data protection is part of good practice. Backups, appropriate access controls and exportable formats reduce loss risk. Keeping an athlete's entire history trapped in an application without export is unwise. Video and medical information may also be sensitive. Collection should match the intended purpose, respect consent and comply with applicable rules. Measurable performance does not justify unlimited surveillance.
23. An accessible laboratory: phone, tape measure and spreadsheet
The phrase Data Lab does not automatically require expensive sensors, a university facility or a large technical staff. For many questions, a simple toolkit suffices: tape measure, suitable phone video, tripod, access to a scale, spreadsheet and recording protocol. Consistent use turns these objects into a measurement system. Footage captured from unrelated angles in every session may be less useful than modest recordings made consistently from one well-chosen position.
The first step is selecting a meaningful event. Consider a twenty-metre Farmer’s test at a safe, relevant load. Measure the course, describe the handles, define timing and place the camera so temporal landmarks can be observed. Collect trials across appropriate sessions rather than necessarily performing several maximal attempts in one day. The goal is comparability, not producing the most spectacular internet footage.
Next comes the collection procedure. Who is timing? Will official time, video or both be used? What happens when handles are dropped? How are incomplete attempts recorded? Which version of the table contains raw data? These rules may fit on one page. Their value is disproportionate because they prevent later disagreement about what was actually measured. A short protocol followed carefully can be a genuine technical advantage.
Data quality should then be checked after each session. Are times plausible, has distance remained constant, did the equipment work and do notes capture changes? Figures should not be modified merely to create an attractive trend. Unusual observations can remain with their known causes. After a month, times and, when available, split sections can be compared. Conclusions should reflect the standardised conditions rather than ignore meaningful differences.
An accessible report might contain one weekly time chart and a short observations page. Another visualisation could show how time changes with load. Dozens of plots repeating the same message are unnecessary. A useful figure includes a title, units, a clear legend and a data source. If colour is used, meanings should be consistent. Tables preserve exact values while the chart reveals the broader pattern.
The final step turns analysis into a decision. If the first five metres appear limiting, relevant pickup and acceleration work may be planned. If decline is greatest near the finish, tolerance and pacing deserve investigation without prematurely claiming the cause. Repeat the test after a meaningful period. This is the basic useful laboratory cycle: question, protocol, observation, analysis, intervention and verification. Technology can improve individual steps but cannot replace their logical order.
24. Hypothetical case study: why identical finishing times are not identical performances
Consider two hypothetical athletes, A and B, with different ages and backgrounds, performing an identical twenty-metre Farmer’s Walk at 120 kilograms per hand. The surface is dry, the route straight and timing includes pickup. Both finish in exactly 20.0 seconds. Total time alone does not establish who starts better, who maintains speed or who came closer to losing grip. Their official outcomes match, yet movement analysis can reveal different patterns.
In the constructed example, A covers the first five metres in 6.0 seconds, with subsequent sections of 4.4, 4.5 and 5.1 seconds. B records 4.8, 5.0, 5.0 and 5.2 seconds. Both totals are 20.0 seconds. A starts more slowly, accelerates after pickup and then loses some pace. B begins faster but maintains a relatively stable speed with modest late slowing. These observations can suggest distinct technical questions but cannot diagnose energy systems or grip function on their own.
Suppose video shows that A has a slow pickup but moves well once the handles are clear of the floor. A possible objective would be improving the initial position and transition to the first step. For B, where walking is stable, the coach might investigate speed development through the middle sections. Such decisions should still be checked against training history and physical readiness. Labelling a segment weak solely because another athlete completed it faster is insufficient.
Four weeks later, A repeats the test in 19.2 seconds and B records 19.4. It is tempting to claim that A's training programme is superior. But these two people do not constitute a controlled comparison of programmes; backgrounds and responses differ. We can say each recorded a better result within their own standardised tests, subject to method reliability. Causal comparisons between programmes need suitable study design and adequate samples.
Now change one variable: the organiser adds a turnaround after ten metres. A and B may respond differently because of stability, technique and footwear. Predictions based on the straight-course test become less certain. This is why a good database preserves course-specific results rather than only the fastest historical speed. Performance belongs to the interaction between athlete and task, not a number that can be transported without context.
The hypothetical example also demonstrates analytical restraint. Data support describing splits, identifying training questions and following changes. They do not justify definitive claims about anatomy, psychology or genetic potential. The further a conclusion moves beyond what was actually measured, the more evidence it requires. Data Lab exists to keep that boundary clear even when attractive graphs tempt exaggerated interpretations.
25. Responsible interpretation: what a graph cannot prove
A graph can show that an athlete has become faster in a standardised test without proving why the change occurred. Muscular adaptation, technical learning, reduced fatigue and environmental conditions may contribute simultaneously. Introducing a new training programme does not automatically establish that it caused the improvement. Causal comparisons require relevant control of alternative explanations or research designs capable of supporting inference. In an individual log, saying the result improved during this period is often more defensible than claiming one exercise produced the change.
Selective reporting can create misleading impressions. Publishing only the fastest runs while omitting failed attempts turns a history into a curated set of favourable moments. A record album can be motivational, but cannot replace complete analysis. Changing the preferred outcome after seeing the data can also manufacture apparent progress. Primary tests and interpretation rules are best established before the training cycle, with additional exploratory observations clearly identified as such.
Generalisation has limits. Strongman studies often involve small samples, and participants vary in sex, division, experience and technical profile. A relationship observed within one group does not automatically apply to every individual. Recommendations should match the evidence quality and be assessed against each athlete's circumstances. Personal records can improve coaching decisions, but one athlete's experience cannot become a universal law of the sport.
Another danger is equating improvement in an intermediate metric with a competitive advantage. Bar speed at a submaximal load may increase, yet if an athlete loses control of a Log under contest conditions, the final result can remain modest. The relationship between monitoring metrics and real objectives must be considered: legally accepted points earned while remaining safe. Attractive app numbers do not necessarily become a platform advantage.
Responsible scientific writing describes findings and their limitations together. Direct measurement, estimation and hypothesis remain visibly distinct. Where data are insufficient, this should be stated openly. Such restraint strengthens rather than weakens credibility. Data Lab is not meant to produce spectacular certainty, but to help people make better decisions without confusing numerical precision with truth.
26. Data ethics: consent, privacy and the right not to be measured
Athletic performance can be analysed without turning athletes into objects of continuous surveillance. Video, sleep data, injury histories and some health information may be sensitive. Collection requires a clear purpose and access limited to people who legitimately need the information. Athletes should understand what is recorded, who can view it and how it may influence training decisions. Greater technological capability does not justify unlimited intrusion into private life.
Consent to filming a training session is not automatically consent to publishing the footage. Other athletes or spectators visible in the recording introduce additional considerations. A coach may retain footage for technical review without converting it into public promotional material. Research uses of the same material may require ethics procedures and protections beyond those of an individual training log. Purpose and context shape the responsibilities involved.
Sound storage includes authentication, backups, sharing rules and the ability to export information in usable formats. When an application offers inadequate data control, convenience needs to be weighed against the risk of loss or unwanted use. Team reports should avoid unnecessary medical and personal details. A table of competition outcomes generally does not require unrestricted disclosure of the athlete's private life.
Metrics should not stigmatise athletes who report tiredness or pain. If a low readiness score produces ridicule or pressure, athletes may begin entering inaccurate values, undermining the monitoring system itself. Useful data depend on trust. Coaches can explain that observations support adjustment and safety rather than moral judgements about character, commitment or toughness. Respectful interpretation is therefore a practical requirement as well as an ethical one.
Data belong within a cooperative relationship. Athletes bring lived experience, effort and context; coaches bring interpretation; technology contributes further observations. None renders the others unnecessary. Ethical practice involves transparency, applicable legal protections and proportionate use. Technically excellent analysis that damages autonomy, privacy or health cannot be considered a complete professional success.
27. A starting protocol for STRONGMAN DATA LAB
We can begin by selecting two or three representative tests rather than ten at once. An athlete might use a standardised submaximal Deadlift, a twenty-metre Farmer’s test and one event addressing a known weakness, such as Log for repetitions. Each test receives a definition: load, distance, technical criteria, timing method and execution conditions. Demanding exercises do not require weekly maximal testing. Loads should suit the athlete's level and fit a programme that allows adequate recovery rather than serve data collection at any cost.
During the initial period, determine whether tests can be repeated with sufficient consistency. Observe variation without interpreting every change immediately as progress. When results are widely dispersed, investigate possible causes: timing procedure, unfamiliarity with equipment, changing surfaces or different warm-up routines. Sometimes the test should be simplified. Repeatability matters more than the quantity of information, while technical familiarisation belongs inside the measurement method.
During the next period, data can inform training. Slow Farmer’s starts may prompt examination of handle pickup and initial steps. Numerous invalid Log repetitions may suggest that technique, not immediate load increases, should become a priority. Repeatedly deteriorating submaximal results combined with reported fatigue can justify reviewing workload and recovery. These choices should be discussed with the athlete and coach instead of mechanically executed by an equation that cannot understand context.
At the cycle's end, repeat comparable tests and report absolute change, percentage change and limitations. One second may be important on a short course, but timing uncertainty must first be considered. Estimated one-repetition maxima should never be mixed unlabelled with official records, and tests using different implements remain separate. Reports should explain what changed, whether the evidence exceeds ordinary variation, and what cannot yet be determined.
Later episodes will develop every component: building a database, relating 1RM to dynamic events, execution velocity, Farmer’s and Yoke split times, repetitions, load, video, statistical models and integration into a complete monitoring system. The opening episode does not promise an algorithm that knows everything about an athlete. It provides a method for asking better questions. When observations are sound, context preserved and hypotheses tested, numbers become useful without turning into myths.
The final principle is straightforward: we measure to make decisions, rather than make decisions to justify what we happened to measure. Results should challenge coaching expectations rather than merely confirm them. When figures change, review the test definition, conditions and error before announcing a discovery. Strongman will remain a sport of extraordinary strength, but it can also become a sport in which progress is explained with respect for science, athletes and the actual demands of the platform.
Selected scientific references
[1] Hindle, B. R., Lorimer, A., Winwood, P., & Keogh, J. W. L. (2019). The Biomechanics and Applications of Strongman Exercises: A Systematic Review. Sports Medicine - Open, 5, 49. DOI: 10.1186/s40798-019-0222-z. https://doi.org/10.1186/s40798-019-0222-z
[2] McGill, S. M., McDermott, A., & Fenwick, C. M. J. (2009). Comparison of Different Strongman Events: Trunk Muscle Activation and Lumbar Spine Motion, Load, and Stiffness. Journal of Strength and Conditioning Research, 23(4), 1148–1161. DOI: 10.1519/JSC.0b013e318198f8f7. https://doi.org/10.1519/JSC.0b013e318198f8f7
[3] Winwood, P. W., Cronin, J. B., Brown, S. R., & Keogh, J. W. L. (2014). A Biomechanical Analysis of the Farmers Walk, and Comparison with the Deadlift and Unloaded Walk. International Journal of Sports Science & Coaching, 9(5), 1127–1143. DOI: 10.1260/1747-9541.9.5.1127. https://doi.org/10.1260/1747-9541.9.5.1127
[4] Hindle, B. R., Lorimer, A., Winwood, P., Brimm, D., & Keogh, J. W. L. (2021). The Biomechanical Characteristics of the Strongman Yoke Walk. Frontiers in Sports and Active Living, 3, 670297. DOI: 10.3389/fspor.2021.670297. https://doi.org/10.3389/fspor.2021.670297
[5] Atkinson, G., & Nevill, A. M. (1998). Statistical Methods for Assessing Measurement Error (Reliability) in Variables Relevant to Sports Medicine. Sports Medicine, 26(4), 217–238. DOI: 10.2165/00007256-199826040-00002. https://doi.org/10.2165/00007256-199826040-00002
[6] Hopkins, W. G. (2000). Measures of Reliability in Sports Medicine and Science. Sports Medicine, 30(1), 1–15. DOI: 10.2165/00007256-200030010-00001. https://doi.org/10.2165/00007256-200030010-00001
[7] Weakley, J., Mann, B., Banyard, H., McLaren, S., Scott, T., & García-Ramos, A. (2021). Velocity-Based Training: From Theory to Application. Strength and Conditioning Journal, 43(2), 31–49. DOI: 10.1519/SSC.0000000000000560. https://doi.org/10.1519/SSC.0000000000000560
[8] Saw, A. E., Main, L. C., & Gastin, P. B. (2016). Monitoring the Athlete Training Response: Subjective Self-Reported Measures Trump Commonly Used Objective Measures: A Systematic Review. British Journal of Sports Medicine, 50(5), 281–291. DOI: 10.1136/bjsports-2015-094758. https://doi.org/10.1136/bjsports-2015-094758
[9] Soligard, T., Schwellnus, M., Alonso, J. M., et al. (2016). How Much Is Too Much? (Part 1) International Olympic Committee Consensus Statement on Load in Sport and Risk of Injury. British Journal of Sports Medicine, 50(17), 1030–1041. DOI: 10.1136/bjsports-2016-096581. https://doi.org/10.1136/bjsports-2016-096581
[10] Winwood, P. W., Hume, P. A., Cronin, J. B., & Keogh, J. W. L. (2014). Retrospective Injury Epidemiology of Strongman Athletes. Journal of Strength and Conditioning Research, 28(1), 28–42. DOI: 10.1519/JSC.0b013e3182986c0c. https://doi.org/10.1519/JSC.0b013e3182986c0c
[11] Koo, T. K., & Li, M. Y. (2016). A Guideline of Selecting and Reporting Intraclass Correlation Coefficients for Reliability Research. Journal of Chiropractic Medicine, 15(2), 155–163. DOI: 10.1016/j.jcm.2016.02.012. https://doi.org/10.1016/j.jcm.2016.02.012
[12] Bland, J. M., & Altman, D. G. (1986). Statistical Methods for Assessing Agreement Between Two Methods of Clinical Measurement. The Lancet, 327(8476), 307–310. DOI: 10.1016/S0140-6736(86)90837-8. https://doi.org/10.1016/S0140-6736(86)90837-8
More From The Journal
Training
The Science of Strongman Training - Episode X: Competition Programming
How to build a complete Strongman competition preparation block: calendar, events, volume, intensity, specificity, simulations, autoregulation, tapering and fatigue management.
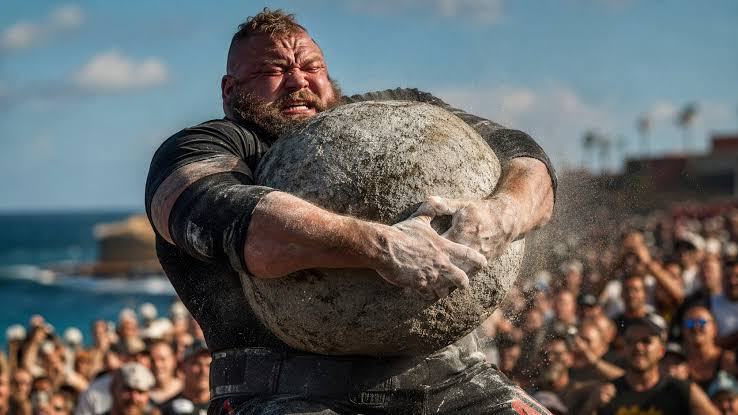
Training
The Science of Strongman Training - Episode IX: Peaking
Peaking in Strongman: how to turn months of training into maximal competition performance by reducing fatigue, preserving adaptations and managing specificity.